Venezuelan vs Puget Sound Salish Male Disability
COMPARE
Venezuelan
Puget Sound Salish
Male Disability
Male Disability Comparison
Venezuelans
Puget Sound Salish
10.1%
MALE DISABILITY
99.9/ 100
METRIC RATING
29th/ 347
METRIC RANK
13.5%
MALE DISABILITY
0.0/ 100
METRIC RATING
313th/ 347
METRIC RANK
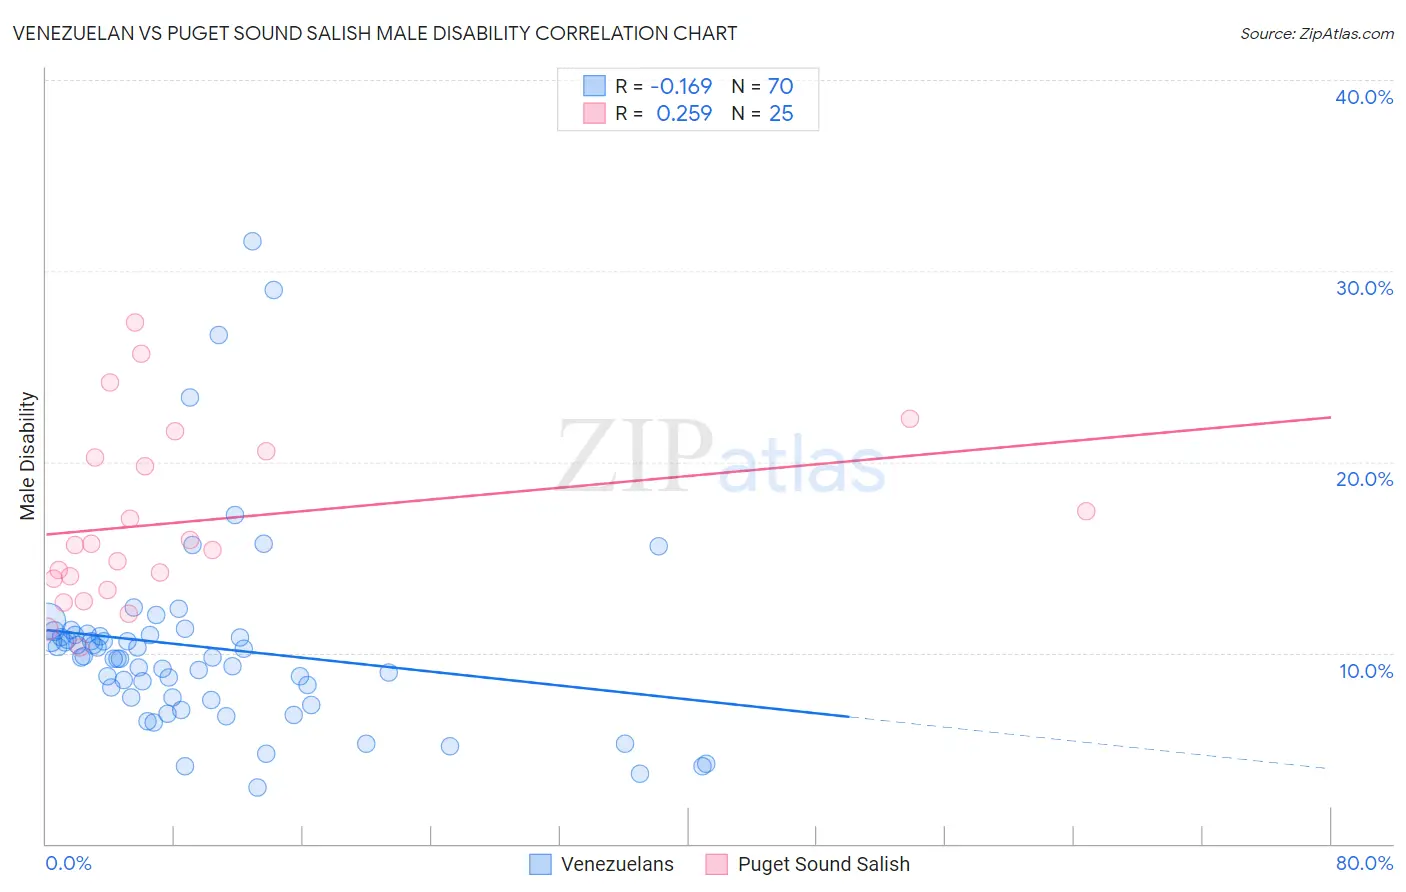
Venezuelan vs Puget Sound Salish Male Disability Correlation Chart
The statistical analysis conducted on geographies consisting of 306,294,374 people shows a poor negative correlation between the proportion of Venezuelans and percentage of males with a disability in the United States with a correlation coefficient (R) of -0.169 and weighted average of 10.1%. Similarly, the statistical analysis conducted on geographies consisting of 46,152,398 people shows a weak positive correlation between the proportion of Puget Sound Salish and percentage of males with a disability in the United States with a correlation coefficient (R) of 0.259 and weighted average of 13.5%, a difference of 34.0%.
Male Disability Correlation Summary
| Measurement | Venezuelan | Puget Sound Salish |
| Minimum | 2.9% | 10.3% |
| Maximum | 31.6% | 27.3% |
| Range | 28.7% | 17.0% |
| Mean | 10.3% | 16.9% |
| Median | 9.8% | 15.6% |
| Interquartile 25% (IQ1) | 7.6% | 13.6% |
| Interquartile 75% (IQ3) | 10.9% | 20.4% |
| Interquartile Range (IQR) | 3.3% | 6.8% |
| Standard Deviation (Sample) | 5.2% | 4.6% |
| Standard Deviation (Population) | 5.2% | 4.5% |
Similar Demographics by Male Disability
Demographics Similar to Venezuelans by Male Disability
In terms of male disability, the demographic groups most similar to Venezuelans are Immigrants from Egypt (10.1%, a difference of 0.040%), Soviet Union (10.1%, a difference of 0.10%), Vietnamese (10.1%, a difference of 0.15%), Egyptian (10.1%, a difference of 0.17%), and Argentinean (10.1%, a difference of 0.25%).
| Demographics | Rating | Rank | Male Disability |
| Immigrants | Venezuela | 100.0 /100 | #22 | Exceptional 10.0% |
| Cypriots | 100.0 /100 | #23 | Exceptional 10.0% |
| Immigrants | Asia | 100.0 /100 | #24 | Exceptional 10.0% |
| Immigrants | Malaysia | 99.9 /100 | #25 | Exceptional 10.0% |
| Paraguayans | 99.9 /100 | #26 | Exceptional 10.1% |
| Egyptians | 99.9 /100 | #27 | Exceptional 10.1% |
| Vietnamese | 99.9 /100 | #28 | Exceptional 10.1% |
| Venezuelans | 99.9 /100 | #29 | Exceptional 10.1% |
| Immigrants | Egypt | 99.9 /100 | #30 | Exceptional 10.1% |
| Soviet Union | 99.9 /100 | #31 | Exceptional 10.1% |
| Argentineans | 99.9 /100 | #32 | Exceptional 10.1% |
| Immigrants | Ethiopia | 99.9 /100 | #33 | Exceptional 10.2% |
| Immigrants | Turkey | 99.9 /100 | #34 | Exceptional 10.2% |
| Immigrants | Argentina | 99.9 /100 | #35 | Exceptional 10.2% |
| Ethiopians | 99.8 /100 | #36 | Exceptional 10.2% |
Demographics Similar to Puget Sound Salish by Male Disability
In terms of male disability, the demographic groups most similar to Puget Sound Salish are Yakama (13.5%, a difference of 0.020%), Aleut (13.5%, a difference of 0.060%), Iroquois (13.6%, a difference of 0.22%), Alaska Native (13.6%, a difference of 0.27%), and Delaware (13.5%, a difference of 0.57%).
| Demographics | Rating | Rank | Male Disability |
| Spanish Americans | 0.0 /100 | #306 | Tragic 13.3% |
| Arapaho | 0.0 /100 | #307 | Tragic 13.3% |
| French American Indians | 0.0 /100 | #308 | Tragic 13.4% |
| Blackfeet | 0.0 /100 | #309 | Tragic 13.4% |
| Immigrants | Azores | 0.0 /100 | #310 | Tragic 13.4% |
| Delaware | 0.0 /100 | #311 | Tragic 13.5% |
| Yakama | 0.0 /100 | #312 | Tragic 13.5% |
| Puget Sound Salish | 0.0 /100 | #313 | Tragic 13.5% |
| Aleuts | 0.0 /100 | #314 | Tragic 13.5% |
| Iroquois | 0.0 /100 | #315 | Tragic 13.6% |
| Alaska Natives | 0.0 /100 | #316 | Tragic 13.6% |
| Paiute | 0.0 /100 | #317 | Tragic 13.7% |
| Cree | 0.0 /100 | #318 | Tragic 13.7% |
| Americans | 0.0 /100 | #319 | Tragic 13.8% |
| Tlingit-Haida | 0.0 /100 | #320 | Tragic 13.8% |