Venezuelan vs Puget Sound Salish Family Households with Children
COMPARE
Venezuelan
Puget Sound Salish
Family Households with Children
Family Households with Children Comparison
Venezuelans
Puget Sound Salish
29.4%
FAMILY HOUSEHOLDS WITH CHILDREN
100.0/ 100
METRIC RATING
33rd/ 347
METRIC RANK
27.4%
FAMILY HOUSEHOLDS WITH CHILDREN
46.2/ 100
METRIC RATING
182nd/ 347
METRIC RANK
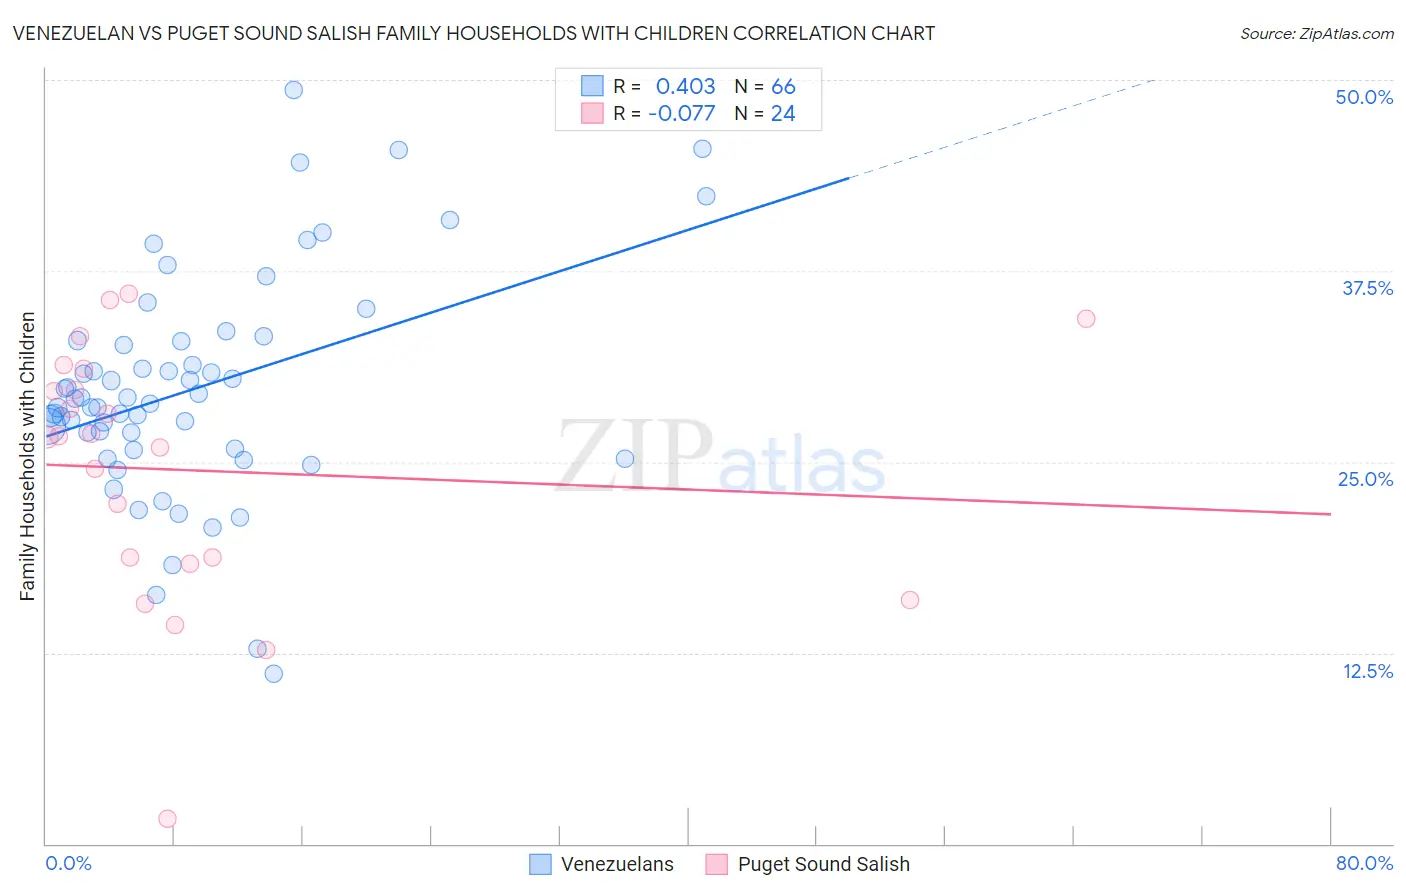
Venezuelan vs Puget Sound Salish Family Households with Children Correlation Chart
The statistical analysis conducted on geographies consisting of 306,091,961 people shows a moderate positive correlation between the proportion of Venezuelans and percentage of family households with children in the United States with a correlation coefficient (R) of 0.403 and weighted average of 29.4%. Similarly, the statistical analysis conducted on geographies consisting of 46,155,538 people shows a slight negative correlation between the proportion of Puget Sound Salish and percentage of family households with children in the United States with a correlation coefficient (R) of -0.077 and weighted average of 27.4%, a difference of 7.1%.
Family Households with Children Correlation Summary
| Measurement | Venezuelan | Puget Sound Salish |
| Minimum | 11.2% | 1.6% |
| Maximum | 49.4% | 36.0% |
| Range | 38.2% | 34.3% |
| Mean | 29.8% | 24.4% |
| Median | 29.0% | 26.7% |
| Interquartile 25% (IQ1) | 25.9% | 18.5% |
| Interquartile 75% (IQ3) | 32.9% | 30.4% |
| Interquartile Range (IQR) | 7.0% | 11.9% |
| Standard Deviation (Sample) | 7.3% | 8.5% |
| Standard Deviation (Population) | 7.2% | 8.3% |
Similar Demographics by Family Households with Children
Demographics Similar to Venezuelans by Family Households with Children
In terms of family households with children, the demographic groups most similar to Venezuelans are Immigrants from Bolivia (29.3%, a difference of 0.060%), Immigrants from Yemen (29.4%, a difference of 0.20%), Immigrants from Sierra Leone (29.3%, a difference of 0.22%), Immigrants from Venezuela (29.3%, a difference of 0.23%), and Japanese (29.4%, a difference of 0.26%).
| Demographics | Rating | Rank | Family Households with Children |
| Sri Lankans | 100.0 /100 | #26 | Exceptional 29.5% |
| Immigrants | Vietnam | 100.0 /100 | #27 | Exceptional 29.5% |
| Samoans | 100.0 /100 | #28 | Exceptional 29.5% |
| Bolivians | 100.0 /100 | #29 | Exceptional 29.5% |
| Yuman | 100.0 /100 | #30 | Exceptional 29.5% |
| Japanese | 100.0 /100 | #31 | Exceptional 29.4% |
| Immigrants | Yemen | 100.0 /100 | #32 | Exceptional 29.4% |
| Venezuelans | 100.0 /100 | #33 | Exceptional 29.4% |
| Immigrants | Bolivia | 100.0 /100 | #34 | Exceptional 29.3% |
| Immigrants | Sierra Leone | 100.0 /100 | #35 | Exceptional 29.3% |
| Immigrants | Venezuela | 100.0 /100 | #36 | Exceptional 29.3% |
| Immigrants | Cameroon | 100.0 /100 | #37 | Exceptional 29.2% |
| Koreans | 100.0 /100 | #38 | Exceptional 29.2% |
| Yaqui | 100.0 /100 | #39 | Exceptional 29.1% |
| Central Americans | 100.0 /100 | #40 | Exceptional 29.1% |
Demographics Similar to Puget Sound Salish by Family Households with Children
In terms of family households with children, the demographic groups most similar to Puget Sound Salish are Immigrants from Turkey (27.4%, a difference of 0.010%), Aleut (27.4%, a difference of 0.010%), Turkish (27.4%, a difference of 0.020%), South African (27.4%, a difference of 0.030%), and Native Hawaiian (27.4%, a difference of 0.040%).
| Demographics | Rating | Rank | Family Households with Children |
| British | 49.9 /100 | #175 | Average 27.4% |
| Immigrants | China | 49.6 /100 | #176 | Average 27.4% |
| Ugandans | 49.2 /100 | #177 | Average 27.4% |
| Spanish Americans | 48.9 /100 | #178 | Average 27.4% |
| Turks | 46.9 /100 | #179 | Average 27.4% |
| Immigrants | Turkey | 46.9 /100 | #180 | Average 27.4% |
| Aleuts | 46.7 /100 | #181 | Average 27.4% |
| Puget Sound Salish | 46.2 /100 | #182 | Average 27.4% |
| South Africans | 44.9 /100 | #183 | Average 27.4% |
| Native Hawaiians | 44.6 /100 | #184 | Average 27.4% |
| Delaware | 42.0 /100 | #185 | Average 27.4% |
| Immigrants | Brazil | 40.6 /100 | #186 | Average 27.4% |
| Creek | 39.8 /100 | #187 | Fair 27.4% |
| Dutch | 38.8 /100 | #188 | Fair 27.4% |
| Immigrants | Israel | 37.9 /100 | #189 | Fair 27.4% |