Ugandan vs Immigrants from Lithuania Master's Degree
COMPARE
Ugandan
Immigrants from Lithuania
Master's Degree
Master's Degree Comparison
Ugandans
Immigrants from Lithuania
17.1%
MASTER'S DEGREE
99.0/ 100
METRIC RATING
94th/ 347
METRIC RANK
18.5%
MASTER'S DEGREE
99.9/ 100
METRIC RATING
54th/ 347
METRIC RANK
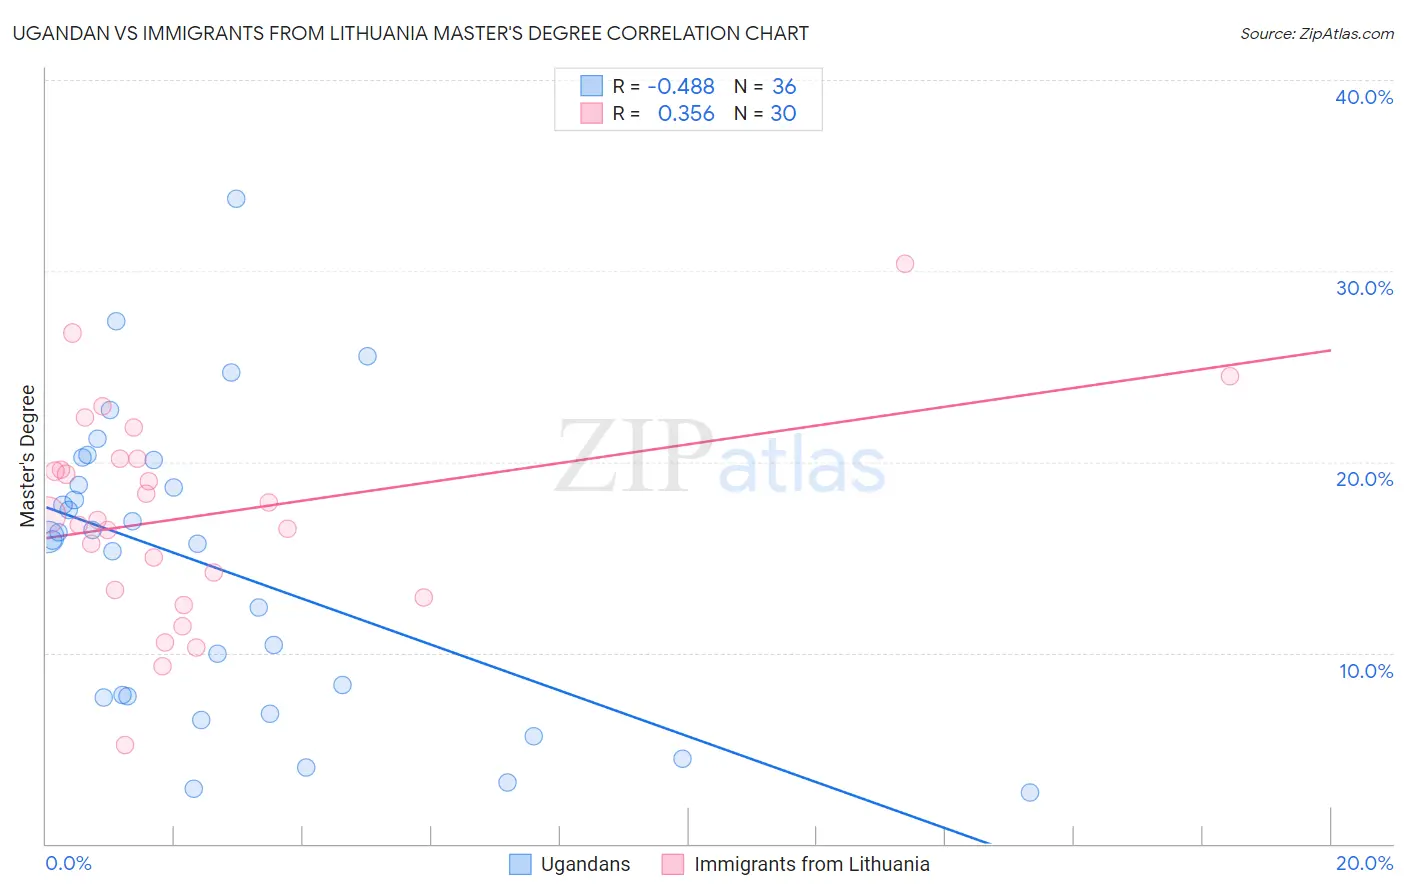
Ugandan vs Immigrants from Lithuania Master's Degree Correlation Chart
The statistical analysis conducted on geographies consisting of 93,998,017 people shows a moderate negative correlation between the proportion of Ugandans and percentage of population with at least master's degree education in the United States with a correlation coefficient (R) of -0.488 and weighted average of 17.1%. Similarly, the statistical analysis conducted on geographies consisting of 117,722,731 people shows a mild positive correlation between the proportion of Immigrants from Lithuania and percentage of population with at least master's degree education in the United States with a correlation coefficient (R) of 0.356 and weighted average of 18.5%, a difference of 7.9%.
Master's Degree Correlation Summary
| Measurement | Ugandan | Immigrants from Lithuania |
| Minimum | 2.7% | 5.1% |
| Maximum | 33.8% | 30.4% |
| Range | 31.1% | 25.3% |
| Mean | 14.4% | 17.2% |
| Median | 16.0% | 17.1% |
| Interquartile 25% (IQ1) | 7.7% | 13.3% |
| Interquartile 75% (IQ3) | 19.4% | 20.1% |
| Interquartile Range (IQR) | 11.8% | 6.8% |
| Standard Deviation (Sample) | 7.7% | 5.4% |
| Standard Deviation (Population) | 7.6% | 5.3% |
Similar Demographics by Master's Degree
Demographics Similar to Ugandans by Master's Degree
In terms of master's degree, the demographic groups most similar to Ugandans are Immigrants from Italy (17.2%, a difference of 0.13%), Immigrants from North America (17.2%, a difference of 0.19%), Romanian (17.2%, a difference of 0.24%), Immigrants from Egypt (17.2%, a difference of 0.31%), and Immigrants from Morocco (17.1%, a difference of 0.32%).
| Demographics | Rating | Rank | Master's Degree |
| Maltese | 99.3 /100 | #87 | Exceptional 17.3% |
| Immigrants | Canada | 99.2 /100 | #88 | Exceptional 17.2% |
| Bhutanese | 99.1 /100 | #89 | Exceptional 17.2% |
| Immigrants | Egypt | 99.1 /100 | #90 | Exceptional 17.2% |
| Romanians | 99.1 /100 | #91 | Exceptional 17.2% |
| Immigrants | North America | 99.1 /100 | #92 | Exceptional 17.2% |
| Immigrants | Italy | 99.1 /100 | #93 | Exceptional 17.2% |
| Ugandans | 99.0 /100 | #94 | Exceptional 17.1% |
| Immigrants | Morocco | 98.9 /100 | #95 | Exceptional 17.1% |
| Immigrants | Northern Africa | 98.9 /100 | #96 | Exceptional 17.1% |
| Immigrants | England | 98.8 /100 | #97 | Exceptional 17.0% |
| Immigrants | Ukraine | 98.8 /100 | #98 | Exceptional 17.0% |
| Laotians | 98.8 /100 | #99 | Exceptional 17.0% |
| Albanians | 98.7 /100 | #100 | Exceptional 17.0% |
| Immigrants | Nepal | 98.6 /100 | #101 | Exceptional 17.0% |
Demographics Similar to Immigrants from Lithuania by Master's Degree
In terms of master's degree, the demographic groups most similar to Immigrants from Lithuania are Immigrants from Serbia (18.5%, a difference of 0.030%), Asian (18.4%, a difference of 0.26%), Immigrants from Czechoslovakia (18.5%, a difference of 0.31%), Immigrants from Kuwait (18.6%, a difference of 0.39%), and Immigrants from Asia (18.4%, a difference of 0.39%).
| Demographics | Rating | Rank | Master's Degree |
| Immigrants | Austria | 100.0 /100 | #47 | Exceptional 18.8% |
| Paraguayans | 100.0 /100 | #48 | Exceptional 18.8% |
| Estonians | 100.0 /100 | #49 | Exceptional 18.8% |
| Bulgarians | 100.0 /100 | #50 | Exceptional 18.8% |
| Immigrants | South Africa | 100.0 /100 | #51 | Exceptional 18.8% |
| Immigrants | Kuwait | 100.0 /100 | #52 | Exceptional 18.6% |
| Immigrants | Czechoslovakia | 99.9 /100 | #53 | Exceptional 18.5% |
| Immigrants | Lithuania | 99.9 /100 | #54 | Exceptional 18.5% |
| Immigrants | Serbia | 99.9 /100 | #55 | Exceptional 18.5% |
| Asians | 99.9 /100 | #56 | Exceptional 18.4% |
| Immigrants | Asia | 99.9 /100 | #57 | Exceptional 18.4% |
| Australians | 99.9 /100 | #58 | Exceptional 18.4% |
| Immigrants | Bulgaria | 99.9 /100 | #59 | Exceptional 18.3% |
| New Zealanders | 99.9 /100 | #60 | Exceptional 18.3% |
| Immigrants | Europe | 99.9 /100 | #61 | Exceptional 18.2% |