Ugandan vs Immigrants from Jordan College, 1 year or more
COMPARE
Ugandan
Immigrants from Jordan
College, 1 year or more
College, 1 year or more Comparison
Ugandans
Immigrants from Jordan
61.2%
COLLEGE, 1 YEAR OR MORE
90.7/ 100
METRIC RATING
129th/ 347
METRIC RANK
61.4%
COLLEGE, 1 YEAR OR MORE
92.7/ 100
METRIC RATING
121st/ 347
METRIC RANK
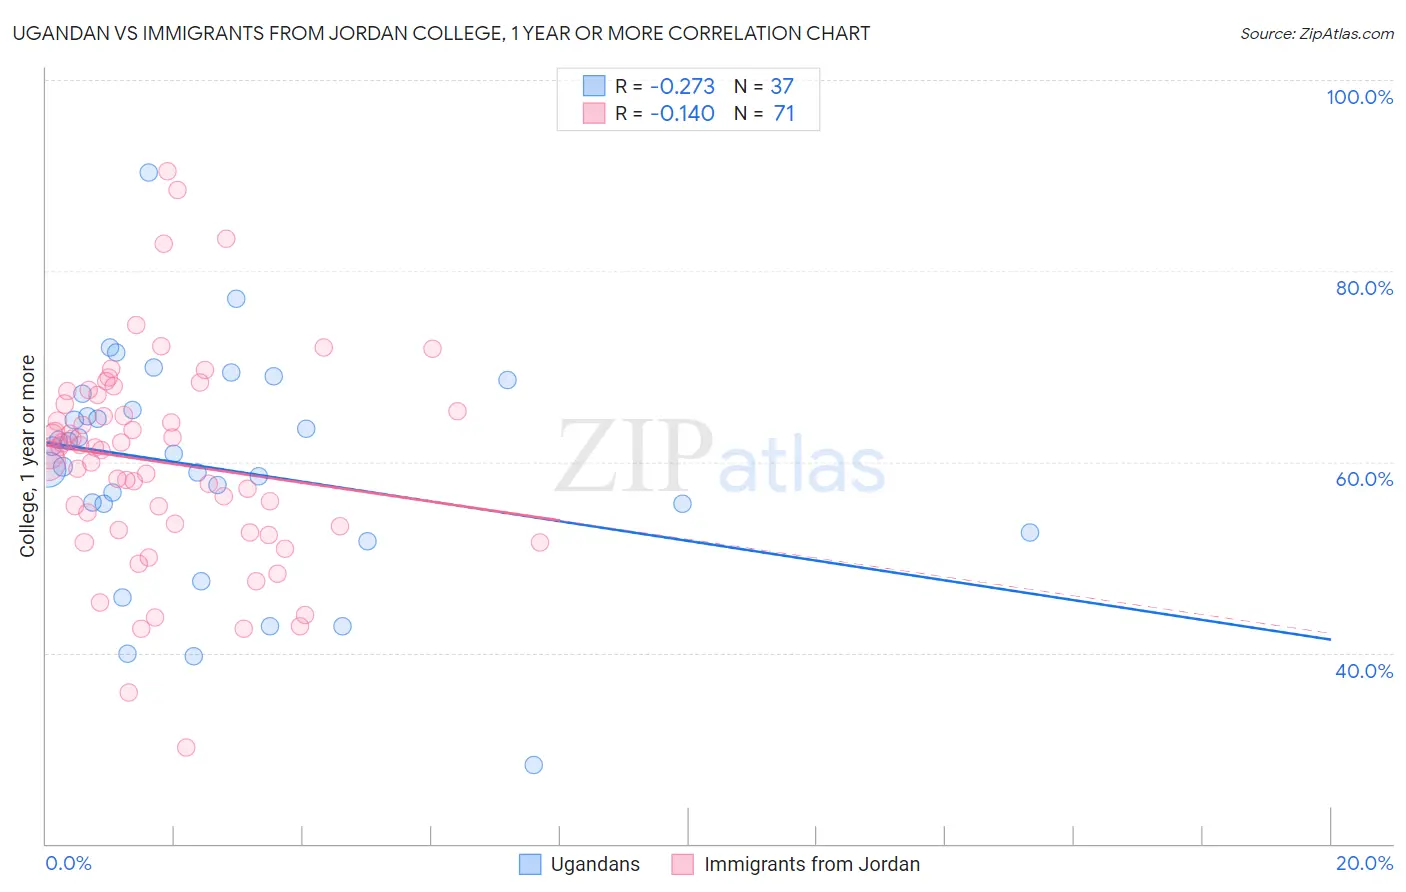
Ugandan vs Immigrants from Jordan College, 1 year or more Correlation Chart
The statistical analysis conducted on geographies consisting of 94,018,576 people shows a weak negative correlation between the proportion of Ugandans and percentage of population with at least college, 1 year or more education in the United States with a correlation coefficient (R) of -0.273 and weighted average of 61.2%. Similarly, the statistical analysis conducted on geographies consisting of 181,276,954 people shows a poor negative correlation between the proportion of Immigrants from Jordan and percentage of population with at least college, 1 year or more education in the United States with a correlation coefficient (R) of -0.140 and weighted average of 61.4%, a difference of 0.34%.
College, 1 year or more Correlation Summary
| Measurement | Ugandan | Immigrants from Jordan |
| Minimum | 28.3% | 30.1% |
| Maximum | 90.3% | 90.5% |
| Range | 62.0% | 60.3% |
| Mean | 59.3% | 60.0% |
| Median | 60.9% | 61.3% |
| Interquartile 25% (IQ1) | 54.1% | 52.9% |
| Interquartile 75% (IQ3) | 66.3% | 66.0% |
| Interquartile Range (IQR) | 12.2% | 13.2% |
| Standard Deviation (Sample) | 11.7% | 11.0% |
| Standard Deviation (Population) | 11.6% | 11.0% |
Demographics Similar to Ugandans and Immigrants from Jordan by College, 1 year or more
In terms of college, 1 year or more, the demographic groups most similar to Ugandans are Immigrants from Italy (61.2%, a difference of 0.060%), Immigrants from Eastern Africa (61.2%, a difference of 0.070%), Alsatian (61.3%, a difference of 0.090%), Immigrants from Syria (61.3%, a difference of 0.14%), and Italian (61.1%, a difference of 0.18%). Similarly, the demographic groups most similar to Immigrants from Jordan are Immigrants from Chile (61.4%, a difference of 0.080%), Pakistani (61.5%, a difference of 0.10%), Serbian (61.4%, a difference of 0.10%), Assyrian/Chaldean/Syriac (61.5%, a difference of 0.11%), and Venezuelan (61.3%, a difference of 0.12%).
| Demographics | Rating | Rank | College, 1 year or more |
| Norwegians | 94.5 /100 | #115 | Exceptional 61.7% |
| Lebanese | 94.1 /100 | #116 | Exceptional 61.6% |
| Arabs | 93.9 /100 | #117 | Exceptional 61.6% |
| Immigrants | Brazil | 93.9 /100 | #118 | Exceptional 61.6% |
| Assyrians/Chaldeans/Syriacs | 93.3 /100 | #119 | Exceptional 61.5% |
| Pakistanis | 93.2 /100 | #120 | Exceptional 61.5% |
| Immigrants | Jordan | 92.7 /100 | #121 | Exceptional 61.4% |
| Immigrants | Chile | 92.3 /100 | #122 | Exceptional 61.4% |
| Serbians | 92.2 /100 | #123 | Exceptional 61.4% |
| Venezuelans | 92.1 /100 | #124 | Exceptional 61.3% |
| Immigrants | Syria | 91.6 /100 | #125 | Exceptional 61.3% |
| Alsatians | 91.3 /100 | #126 | Exceptional 61.3% |
| Immigrants | Eastern Africa | 91.1 /100 | #127 | Exceptional 61.2% |
| Immigrants | Italy | 91.1 /100 | #128 | Exceptional 61.2% |
| Ugandans | 90.7 /100 | #129 | Exceptional 61.2% |
| Italians | 89.5 /100 | #130 | Excellent 61.1% |
| Immigrants | Morocco | 89.5 /100 | #131 | Excellent 61.1% |
| Scandinavians | 88.2 /100 | #132 | Excellent 61.0% |
| Immigrants | Uzbekistan | 88.0 /100 | #133 | Excellent 61.0% |
| Immigrants | Venezuela | 87.9 /100 | #134 | Excellent 61.0% |
| Immigrants | Uganda | 87.4 /100 | #135 | Excellent 60.9% |