Ugandan vs Comanche Master's Degree
COMPARE
Ugandan
Comanche
Master's Degree
Master's Degree Comparison
Ugandans
Comanche
17.1%
MASTER'S DEGREE
99.0/ 100
METRIC RATING
94th/ 347
METRIC RANK
12.1%
MASTER'S DEGREE
0.3/ 100
METRIC RATING
272nd/ 347
METRIC RANK
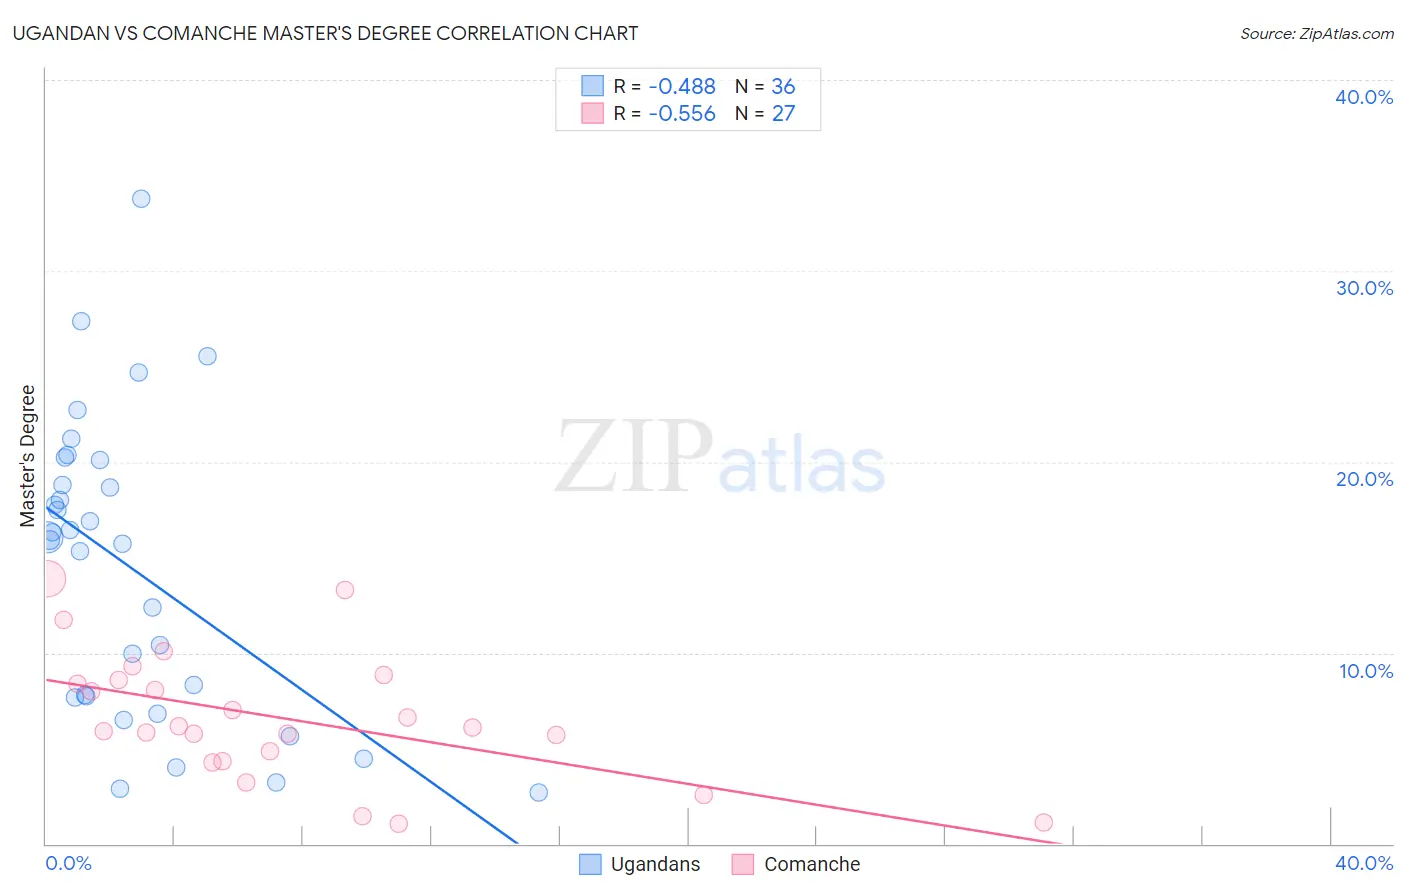
Ugandan vs Comanche Master's Degree Correlation Chart
The statistical analysis conducted on geographies consisting of 93,998,017 people shows a moderate negative correlation between the proportion of Ugandans and percentage of population with at least master's degree education in the United States with a correlation coefficient (R) of -0.488 and weighted average of 17.1%. Similarly, the statistical analysis conducted on geographies consisting of 109,770,893 people shows a substantial negative correlation between the proportion of Comanche and percentage of population with at least master's degree education in the United States with a correlation coefficient (R) of -0.556 and weighted average of 12.1%, a difference of 41.6%.
Master's Degree Correlation Summary
| Measurement | Ugandan | Comanche |
| Minimum | 2.7% | 1.0% |
| Maximum | 33.8% | 13.9% |
| Range | 31.1% | 12.9% |
| Mean | 14.4% | 6.6% |
| Median | 16.0% | 6.1% |
| Interquartile 25% (IQ1) | 7.7% | 4.3% |
| Interquartile 75% (IQ3) | 19.4% | 8.6% |
| Interquartile Range (IQR) | 11.8% | 4.3% |
| Standard Deviation (Sample) | 7.7% | 3.4% |
| Standard Deviation (Population) | 7.6% | 3.3% |
Similar Demographics by Master's Degree
Demographics Similar to Ugandans by Master's Degree
In terms of master's degree, the demographic groups most similar to Ugandans are Immigrants from Italy (17.2%, a difference of 0.13%), Immigrants from North America (17.2%, a difference of 0.19%), Romanian (17.2%, a difference of 0.24%), Immigrants from Egypt (17.2%, a difference of 0.31%), and Immigrants from Morocco (17.1%, a difference of 0.32%).
| Demographics | Rating | Rank | Master's Degree |
| Maltese | 99.3 /100 | #87 | Exceptional 17.3% |
| Immigrants | Canada | 99.2 /100 | #88 | Exceptional 17.2% |
| Bhutanese | 99.1 /100 | #89 | Exceptional 17.2% |
| Immigrants | Egypt | 99.1 /100 | #90 | Exceptional 17.2% |
| Romanians | 99.1 /100 | #91 | Exceptional 17.2% |
| Immigrants | North America | 99.1 /100 | #92 | Exceptional 17.2% |
| Immigrants | Italy | 99.1 /100 | #93 | Exceptional 17.2% |
| Ugandans | 99.0 /100 | #94 | Exceptional 17.1% |
| Immigrants | Morocco | 98.9 /100 | #95 | Exceptional 17.1% |
| Immigrants | Northern Africa | 98.9 /100 | #96 | Exceptional 17.1% |
| Immigrants | England | 98.8 /100 | #97 | Exceptional 17.0% |
| Immigrants | Ukraine | 98.8 /100 | #98 | Exceptional 17.0% |
| Laotians | 98.8 /100 | #99 | Exceptional 17.0% |
| Albanians | 98.7 /100 | #100 | Exceptional 17.0% |
| Immigrants | Nepal | 98.6 /100 | #101 | Exceptional 17.0% |
Demographics Similar to Comanche by Master's Degree
In terms of master's degree, the demographic groups most similar to Comanche are Haitian (12.1%, a difference of 0.060%), Blackfeet (12.1%, a difference of 0.090%), Cape Verdean (12.1%, a difference of 0.18%), Cuban (12.1%, a difference of 0.20%), and Black/African American (12.1%, a difference of 0.25%).
| Demographics | Rating | Rank | Master's Degree |
| Immigrants | Fiji | 0.5 /100 | #265 | Tragic 12.4% |
| Bahamians | 0.5 /100 | #266 | Tragic 12.4% |
| Americans | 0.4 /100 | #267 | Tragic 12.3% |
| Native Hawaiians | 0.4 /100 | #268 | Tragic 12.3% |
| Central Americans | 0.3 /100 | #269 | Tragic 12.2% |
| Salvadorans | 0.3 /100 | #270 | Tragic 12.2% |
| Haitians | 0.3 /100 | #271 | Tragic 12.1% |
| Comanche | 0.3 /100 | #272 | Tragic 12.1% |
| Blackfeet | 0.3 /100 | #273 | Tragic 12.1% |
| Cape Verdeans | 0.3 /100 | #274 | Tragic 12.1% |
| Cubans | 0.3 /100 | #275 | Tragic 12.1% |
| Blacks/African Americans | 0.3 /100 | #276 | Tragic 12.1% |
| Immigrants | Caribbean | 0.3 /100 | #277 | Tragic 12.1% |
| Potawatomi | 0.3 /100 | #278 | Tragic 12.1% |
| Immigrants | Belize | 0.2 /100 | #279 | Tragic 12.1% |