Ugandan vs Immigrants from Western Africa Master's Degree
COMPARE
Ugandan
Immigrants from Western Africa
Master's Degree
Master's Degree Comparison
Ugandans
Immigrants from Western Africa
17.1%
MASTER'S DEGREE
99.0/ 100
METRIC RATING
94th/ 347
METRIC RANK
14.4%
MASTER'S DEGREE
24.9/ 100
METRIC RATING
202nd/ 347
METRIC RANK
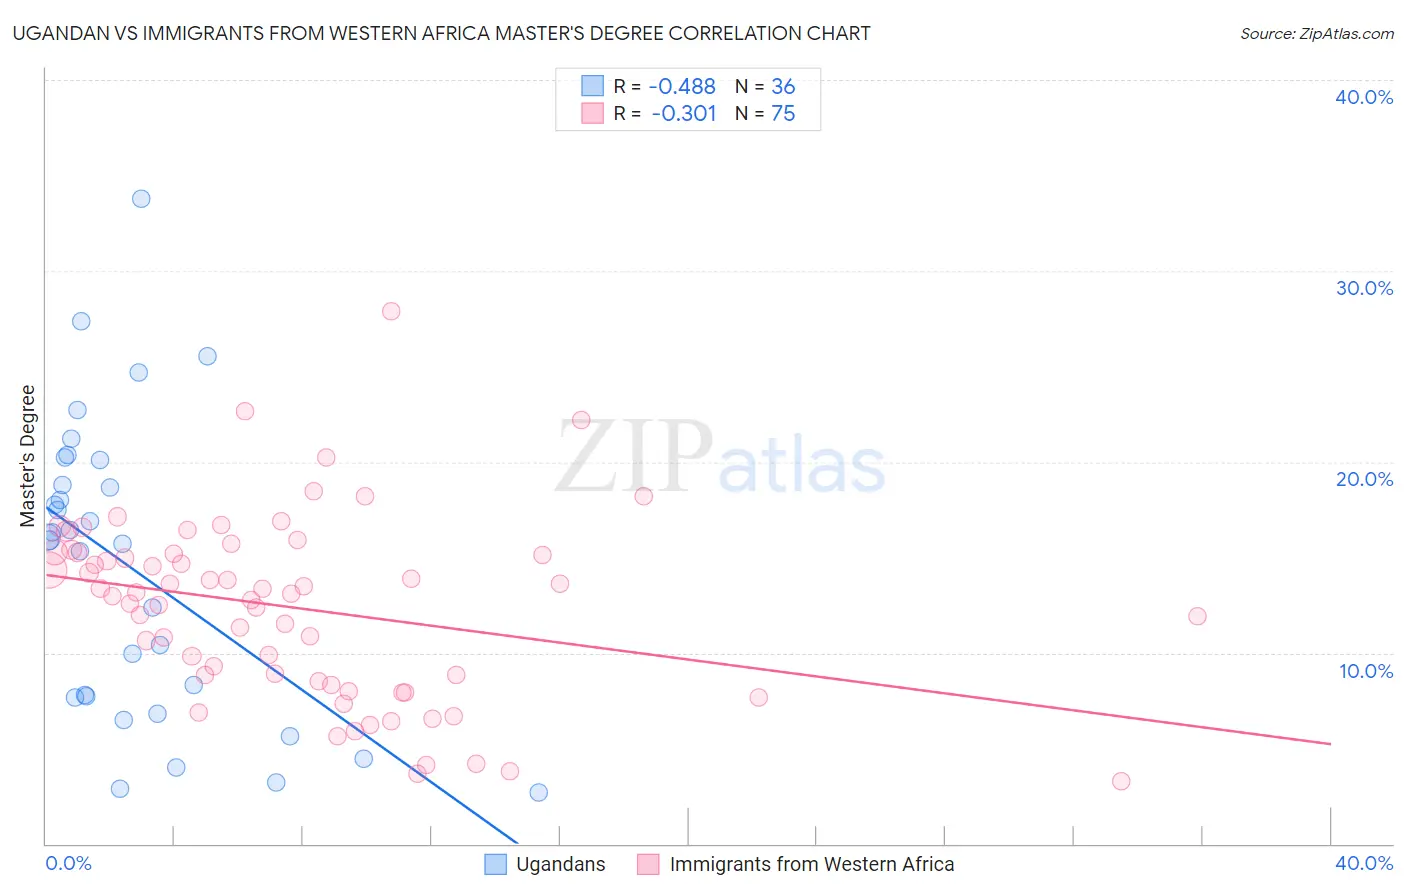
Ugandan vs Immigrants from Western Africa Master's Degree Correlation Chart
The statistical analysis conducted on geographies consisting of 93,998,017 people shows a moderate negative correlation between the proportion of Ugandans and percentage of population with at least master's degree education in the United States with a correlation coefficient (R) of -0.488 and weighted average of 17.1%. Similarly, the statistical analysis conducted on geographies consisting of 357,742,220 people shows a mild negative correlation between the proportion of Immigrants from Western Africa and percentage of population with at least master's degree education in the United States with a correlation coefficient (R) of -0.301 and weighted average of 14.4%, a difference of 19.0%.
Master's Degree Correlation Summary
| Measurement | Ugandan | Immigrants from Western Africa |
| Minimum | 2.7% | 3.3% |
| Maximum | 33.8% | 27.9% |
| Range | 31.1% | 24.6% |
| Mean | 14.4% | 12.4% |
| Median | 16.0% | 13.1% |
| Interquartile 25% (IQ1) | 7.7% | 8.5% |
| Interquartile 75% (IQ3) | 19.4% | 15.3% |
| Interquartile Range (IQR) | 11.8% | 6.8% |
| Standard Deviation (Sample) | 7.7% | 4.8% |
| Standard Deviation (Population) | 7.6% | 4.7% |
Similar Demographics by Master's Degree
Demographics Similar to Ugandans by Master's Degree
In terms of master's degree, the demographic groups most similar to Ugandans are Immigrants from Italy (17.2%, a difference of 0.13%), Immigrants from North America (17.2%, a difference of 0.19%), Romanian (17.2%, a difference of 0.24%), Immigrants from Egypt (17.2%, a difference of 0.31%), and Immigrants from Morocco (17.1%, a difference of 0.32%).
| Demographics | Rating | Rank | Master's Degree |
| Maltese | 99.3 /100 | #87 | Exceptional 17.3% |
| Immigrants | Canada | 99.2 /100 | #88 | Exceptional 17.2% |
| Bhutanese | 99.1 /100 | #89 | Exceptional 17.2% |
| Immigrants | Egypt | 99.1 /100 | #90 | Exceptional 17.2% |
| Romanians | 99.1 /100 | #91 | Exceptional 17.2% |
| Immigrants | North America | 99.1 /100 | #92 | Exceptional 17.2% |
| Immigrants | Italy | 99.1 /100 | #93 | Exceptional 17.2% |
| Ugandans | 99.0 /100 | #94 | Exceptional 17.1% |
| Immigrants | Morocco | 98.9 /100 | #95 | Exceptional 17.1% |
| Immigrants | Northern Africa | 98.9 /100 | #96 | Exceptional 17.1% |
| Immigrants | England | 98.8 /100 | #97 | Exceptional 17.0% |
| Immigrants | Ukraine | 98.8 /100 | #98 | Exceptional 17.0% |
| Laotians | 98.8 /100 | #99 | Exceptional 17.0% |
| Albanians | 98.7 /100 | #100 | Exceptional 17.0% |
| Immigrants | Nepal | 98.6 /100 | #101 | Exceptional 17.0% |
Demographics Similar to Immigrants from Western Africa by Master's Degree
In terms of master's degree, the demographic groups most similar to Immigrants from Western Africa are Scotch-Irish (14.4%, a difference of 0.010%), Panamanian (14.4%, a difference of 0.020%), Yugoslavian (14.4%, a difference of 0.11%), French (14.4%, a difference of 0.22%), and Trinidadian and Tobagonian (14.4%, a difference of 0.26%).
| Demographics | Rating | Rank | Master's Degree |
| Danes | 31.3 /100 | #195 | Fair 14.5% |
| Czechoslovakians | 29.9 /100 | #196 | Fair 14.5% |
| Belgians | 28.0 /100 | #197 | Fair 14.5% |
| West Indians | 27.4 /100 | #198 | Fair 14.5% |
| Immigrants | Armenia | 27.2 /100 | #199 | Fair 14.5% |
| Panamanians | 25.1 /100 | #200 | Fair 14.4% |
| Scotch-Irish | 25.0 /100 | #201 | Fair 14.4% |
| Immigrants | Western Africa | 24.9 /100 | #202 | Fair 14.4% |
| Yugoslavians | 24.3 /100 | #203 | Fair 14.4% |
| French | 23.7 /100 | #204 | Fair 14.4% |
| Trinidadians and Tobagonians | 23.5 /100 | #205 | Fair 14.4% |
| Scandinavians | 23.3 /100 | #206 | Fair 14.4% |
| Immigrants | Bosnia and Herzegovina | 22.0 /100 | #207 | Fair 14.3% |
| Immigrants | Barbados | 20.5 /100 | #208 | Fair 14.3% |
| Immigrants | Panama | 20.0 /100 | #209 | Fair 14.3% |