Ethiopian vs Immigrants from Iran Associate's Degree
COMPARE
Ethiopian
Immigrants from Iran
Associate's Degree
Associate's Degree Comparison
Ethiopians
Immigrants from Iran
50.4%
ASSOCIATE'S DEGREE
99.1/ 100
METRIC RATING
79th/ 347
METRIC RANK
57.7%
ASSOCIATE'S DEGREE
100.0/ 100
METRIC RATING
7th/ 347
METRIC RANK
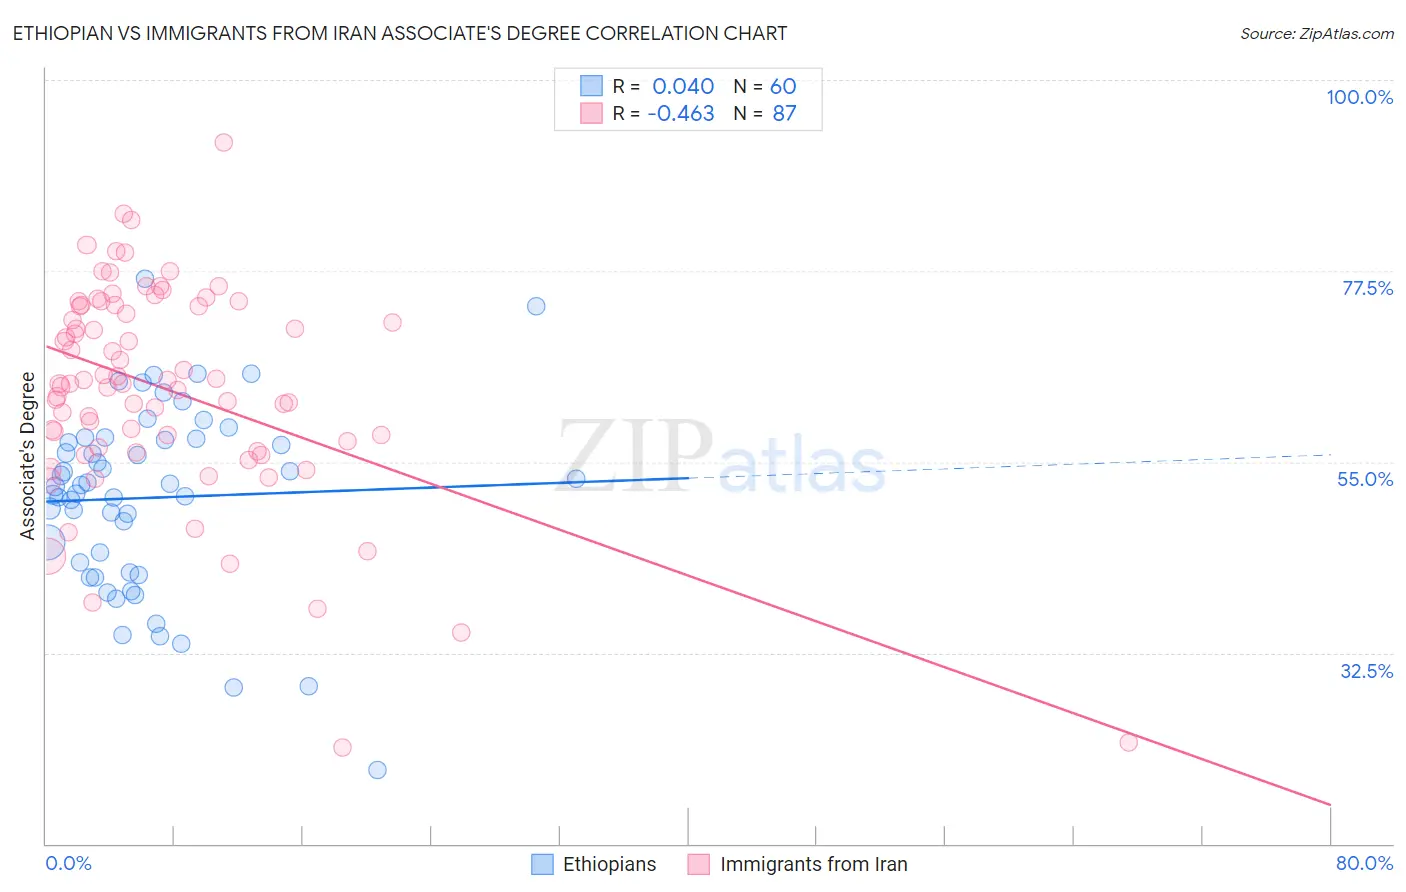
Ethiopian vs Immigrants from Iran Associate's Degree Correlation Chart
The statistical analysis conducted on geographies consisting of 223,259,495 people shows no correlation between the proportion of Ethiopians and percentage of population with at least associate's degree education in the United States with a correlation coefficient (R) of 0.040 and weighted average of 50.4%. Similarly, the statistical analysis conducted on geographies consisting of 279,901,674 people shows a moderate negative correlation between the proportion of Immigrants from Iran and percentage of population with at least associate's degree education in the United States with a correlation coefficient (R) of -0.463 and weighted average of 57.7%, a difference of 14.3%.
Associate's Degree Correlation Summary
| Measurement | Ethiopian | Immigrants from Iran |
| Minimum | 18.6% | 21.3% |
| Maximum | 76.6% | 92.6% |
| Range | 58.0% | 71.3% |
| Mean | 50.8% | 63.6% |
| Median | 52.2% | 64.3% |
| Interquartile 25% (IQ1) | 42.5% | 56.7% |
| Interquartile 75% (IQ3) | 57.6% | 73.4% |
| Interquartile Range (IQR) | 15.1% | 16.8% |
| Standard Deviation (Sample) | 11.1% | 12.7% |
| Standard Deviation (Population) | 11.0% | 12.7% |
Similar Demographics by Associate's Degree
Demographics Similar to Ethiopians by Associate's Degree
In terms of associate's degree, the demographic groups most similar to Ethiopians are Immigrants from Eastern Europe (50.5%, a difference of 0.010%), Armenian (50.4%, a difference of 0.030%), Immigrants from Lebanon (50.5%, a difference of 0.060%), Immigrants from Zimbabwe (50.5%, a difference of 0.090%), and Maltese (50.4%, a difference of 0.10%).
| Demographics | Rating | Rank | Associate's Degree |
| Immigrants | Pakistan | 99.5 /100 | #72 | Exceptional 50.9% |
| Carpatho Rusyns | 99.3 /100 | #73 | Exceptional 50.6% |
| Lithuanians | 99.3 /100 | #74 | Exceptional 50.6% |
| Immigrants | Scotland | 99.3 /100 | #75 | Exceptional 50.6% |
| Immigrants | Zimbabwe | 99.2 /100 | #76 | Exceptional 50.5% |
| Immigrants | Lebanon | 99.1 /100 | #77 | Exceptional 50.5% |
| Immigrants | Eastern Europe | 99.1 /100 | #78 | Exceptional 50.5% |
| Ethiopians | 99.1 /100 | #79 | Exceptional 50.4% |
| Armenians | 99.1 /100 | #80 | Exceptional 50.4% |
| Maltese | 99.1 /100 | #81 | Exceptional 50.4% |
| Greeks | 98.9 /100 | #82 | Exceptional 50.3% |
| Immigrants | Uzbekistan | 98.9 /100 | #83 | Exceptional 50.3% |
| Immigrants | Hungary | 98.9 /100 | #84 | Exceptional 50.2% |
| Immigrants | Egypt | 98.9 /100 | #85 | Exceptional 50.2% |
| Immigrants | Croatia | 98.9 /100 | #86 | Exceptional 50.2% |
Demographics Similar to Immigrants from Iran by Associate's Degree
In terms of associate's degree, the demographic groups most similar to Immigrants from Iran are Okinawan (57.7%, a difference of 0.060%), Thai (57.4%, a difference of 0.40%), Iranian (58.2%, a difference of 0.89%), Immigrants from Taiwan (58.4%, a difference of 1.3%), and Immigrants from Israel (56.8%, a difference of 1.5%).
| Demographics | Rating | Rank | Associate's Degree |
| Filipinos | 100.0 /100 | #1 | Exceptional 59.8% |
| Immigrants | Singapore | 100.0 /100 | #2 | Exceptional 58.9% |
| Immigrants | India | 100.0 /100 | #3 | Exceptional 58.5% |
| Immigrants | Taiwan | 100.0 /100 | #4 | Exceptional 58.4% |
| Iranians | 100.0 /100 | #5 | Exceptional 58.2% |
| Okinawans | 100.0 /100 | #6 | Exceptional 57.7% |
| Immigrants | Iran | 100.0 /100 | #7 | Exceptional 57.7% |
| Thais | 100.0 /100 | #8 | Exceptional 57.4% |
| Immigrants | Israel | 100.0 /100 | #9 | Exceptional 56.8% |
| Cypriots | 100.0 /100 | #10 | Exceptional 56.4% |
| Immigrants | Australia | 100.0 /100 | #11 | Exceptional 55.8% |
| Immigrants | South Central Asia | 100.0 /100 | #12 | Exceptional 55.7% |
| Immigrants | China | 100.0 /100 | #13 | Exceptional 55.5% |
| Immigrants | Hong Kong | 100.0 /100 | #14 | Exceptional 55.4% |
| Immigrants | Eastern Asia | 100.0 /100 | #15 | Exceptional 55.4% |