Cree vs Immigrants from Iran Associate's Degree
COMPARE
Cree
Immigrants from Iran
Associate's Degree
Associate's Degree Comparison
Cree
Immigrants from Iran
42.5%
ASSOCIATE'S DEGREE
1.2/ 100
METRIC RATING
240th/ 347
METRIC RANK
57.7%
ASSOCIATE'S DEGREE
100.0/ 100
METRIC RATING
7th/ 347
METRIC RANK
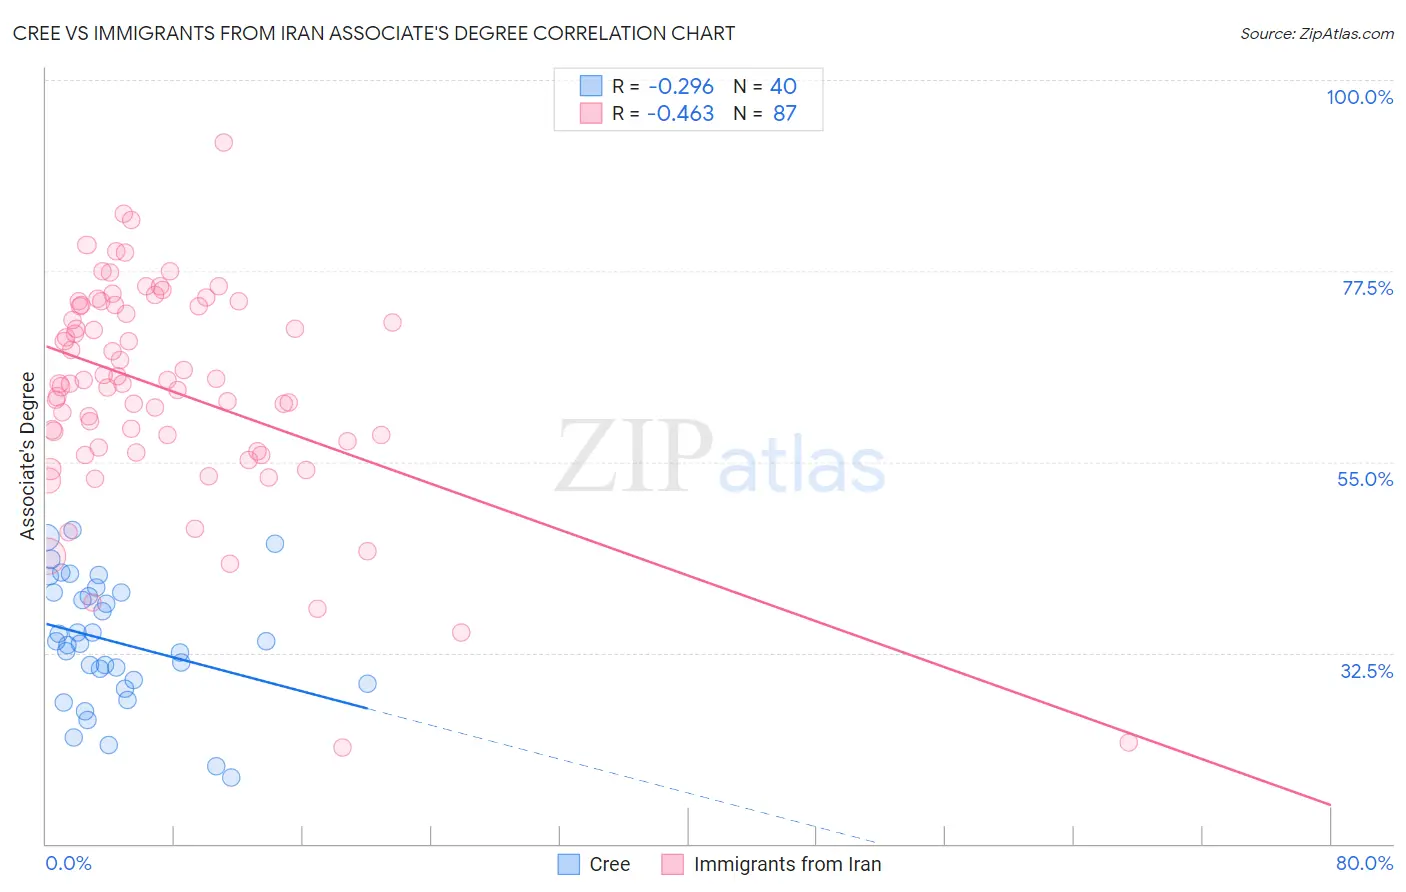
Cree vs Immigrants from Iran Associate's Degree Correlation Chart
The statistical analysis conducted on geographies consisting of 76,211,414 people shows a weak negative correlation between the proportion of Cree and percentage of population with at least associate's degree education in the United States with a correlation coefficient (R) of -0.296 and weighted average of 42.5%. Similarly, the statistical analysis conducted on geographies consisting of 279,901,674 people shows a moderate negative correlation between the proportion of Immigrants from Iran and percentage of population with at least associate's degree education in the United States with a correlation coefficient (R) of -0.463 and weighted average of 57.7%, a difference of 35.6%.
Associate's Degree Correlation Summary
| Measurement | Cree | Immigrants from Iran |
| Minimum | 17.8% | 21.3% |
| Maximum | 46.9% | 92.6% |
| Range | 29.1% | 71.3% |
| Mean | 33.8% | 63.6% |
| Median | 33.7% | 64.3% |
| Interquartile 25% (IQ1) | 29.1% | 56.7% |
| Interquartile 75% (IQ3) | 39.6% | 73.4% |
| Interquartile Range (IQR) | 10.6% | 16.8% |
| Standard Deviation (Sample) | 7.4% | 12.7% |
| Standard Deviation (Population) | 7.3% | 12.7% |
Similar Demographics by Associate's Degree
Demographics Similar to Cree by Associate's Degree
In terms of associate's degree, the demographic groups most similar to Cree are Immigrants from Grenada (42.6%, a difference of 0.18%), British West Indian (42.4%, a difference of 0.33%), Immigrants from West Indies (42.4%, a difference of 0.34%), Guyanese (42.3%, a difference of 0.45%), and Immigrants from Liberia (42.3%, a difference of 0.59%).
| Demographics | Rating | Rank | Associate's Degree |
| Tongans | 2.2 /100 | #233 | Tragic 43.0% |
| Tlingit-Haida | 2.1 /100 | #234 | Tragic 43.0% |
| Ecuadorians | 2.0 /100 | #235 | Tragic 43.0% |
| Immigrants | St. Vincent and the Grenadines | 1.9 /100 | #236 | Tragic 42.9% |
| Immigrants | Nonimmigrants | 1.9 /100 | #237 | Tragic 42.9% |
| Iroquois | 1.7 /100 | #238 | Tragic 42.8% |
| Immigrants | Grenada | 1.3 /100 | #239 | Tragic 42.6% |
| Cree | 1.2 /100 | #240 | Tragic 42.5% |
| British West Indians | 1.0 /100 | #241 | Tragic 42.4% |
| Immigrants | West Indies | 1.0 /100 | #242 | Tragic 42.4% |
| Guyanese | 1.0 /100 | #243 | Tragic 42.3% |
| Immigrants | Liberia | 0.9 /100 | #244 | Tragic 42.3% |
| Immigrants | Cambodia | 0.9 /100 | #245 | Tragic 42.3% |
| Delaware | 0.9 /100 | #246 | Tragic 42.3% |
| Immigrants | Fiji | 0.8 /100 | #247 | Tragic 42.2% |
Demographics Similar to Immigrants from Iran by Associate's Degree
In terms of associate's degree, the demographic groups most similar to Immigrants from Iran are Okinawan (57.7%, a difference of 0.060%), Thai (57.4%, a difference of 0.40%), Iranian (58.2%, a difference of 0.89%), Immigrants from Taiwan (58.4%, a difference of 1.3%), and Immigrants from Israel (56.8%, a difference of 1.5%).
| Demographics | Rating | Rank | Associate's Degree |
| Filipinos | 100.0 /100 | #1 | Exceptional 59.8% |
| Immigrants | Singapore | 100.0 /100 | #2 | Exceptional 58.9% |
| Immigrants | India | 100.0 /100 | #3 | Exceptional 58.5% |
| Immigrants | Taiwan | 100.0 /100 | #4 | Exceptional 58.4% |
| Iranians | 100.0 /100 | #5 | Exceptional 58.2% |
| Okinawans | 100.0 /100 | #6 | Exceptional 57.7% |
| Immigrants | Iran | 100.0 /100 | #7 | Exceptional 57.7% |
| Thais | 100.0 /100 | #8 | Exceptional 57.4% |
| Immigrants | Israel | 100.0 /100 | #9 | Exceptional 56.8% |
| Cypriots | 100.0 /100 | #10 | Exceptional 56.4% |
| Immigrants | Australia | 100.0 /100 | #11 | Exceptional 55.8% |
| Immigrants | South Central Asia | 100.0 /100 | #12 | Exceptional 55.7% |
| Immigrants | China | 100.0 /100 | #13 | Exceptional 55.5% |
| Immigrants | Hong Kong | 100.0 /100 | #14 | Exceptional 55.4% |
| Immigrants | Eastern Asia | 100.0 /100 | #15 | Exceptional 55.4% |