Tsimshian vs Immigrants from Jamaica College, 1 year or more
COMPARE
Tsimshian
Immigrants from Jamaica
College, 1 year or more
College, 1 year or more Comparison
Tsimshian
Immigrants from Jamaica
57.9%
COLLEGE, 1 YEAR OR MORE
13.5/ 100
METRIC RATING
210th/ 347
METRIC RANK
54.2%
COLLEGE, 1 YEAR OR MORE
0.1/ 100
METRIC RATING
278th/ 347
METRIC RANK
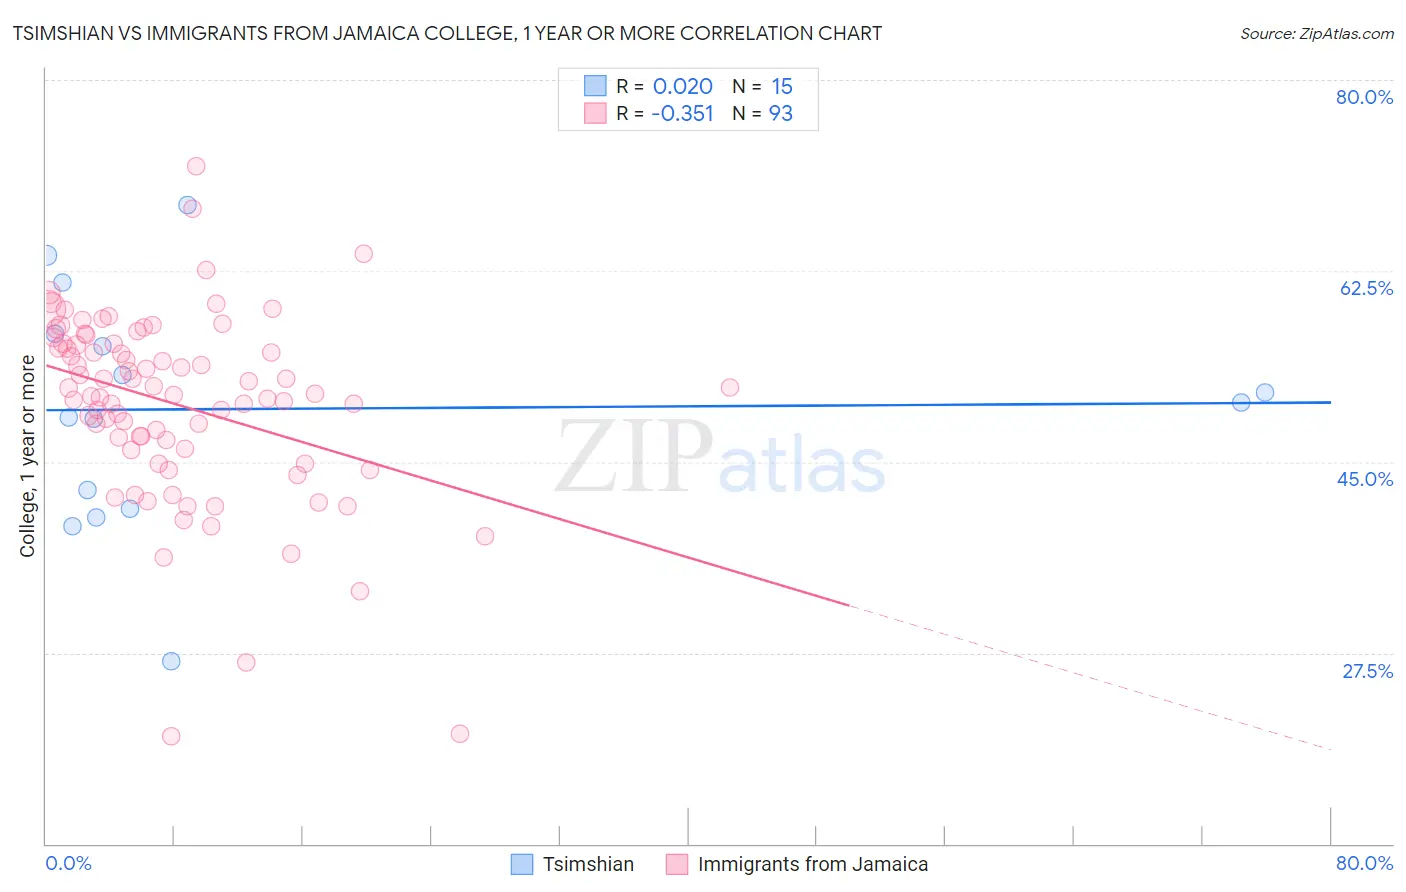
Tsimshian vs Immigrants from Jamaica College, 1 year or more Correlation Chart
The statistical analysis conducted on geographies consisting of 15,626,544 people shows no correlation between the proportion of Tsimshian and percentage of population with at least college, 1 year or more education in the United States with a correlation coefficient (R) of 0.020 and weighted average of 57.9%. Similarly, the statistical analysis conducted on geographies consisting of 301,826,812 people shows a mild negative correlation between the proportion of Immigrants from Jamaica and percentage of population with at least college, 1 year or more education in the United States with a correlation coefficient (R) of -0.351 and weighted average of 54.2%, a difference of 7.0%.
College, 1 year or more Correlation Summary
| Measurement | Tsimshian | Immigrants from Jamaica |
| Minimum | 26.7% | 19.8% |
| Maximum | 68.6% | 72.1% |
| Range | 41.9% | 52.3% |
| Mean | 49.9% | 50.3% |
| Median | 50.5% | 51.2% |
| Interquartile 25% (IQ1) | 40.7% | 46.2% |
| Interquartile 75% (IQ3) | 56.8% | 55.9% |
| Interquartile Range (IQR) | 16.1% | 9.7% |
| Standard Deviation (Sample) | 10.9% | 8.7% |
| Standard Deviation (Population) | 10.6% | 8.7% |
Similar Demographics by College, 1 year or more
Demographics Similar to Tsimshian by College, 1 year or more
In terms of college, 1 year or more, the demographic groups most similar to Tsimshian are Immigrants from Nigeria (57.9%, a difference of 0.020%), Immigrants from Middle Africa (58.0%, a difference of 0.060%), Immigrants from Uruguay (58.1%, a difference of 0.19%), Immigrants from Senegal (57.8%, a difference of 0.20%), and French Canadian (57.8%, a difference of 0.20%).
| Demographics | Rating | Rank | College, 1 year or more |
| Ghanaians | 20.9 /100 | #203 | Fair 58.4% |
| Panamanians | 19.2 /100 | #204 | Poor 58.3% |
| Immigrants | Zaire | 18.7 /100 | #205 | Poor 58.3% |
| Immigrants | Vietnam | 18.2 /100 | #206 | Poor 58.2% |
| Senegalese | 16.9 /100 | #207 | Poor 58.2% |
| Immigrants | Uruguay | 15.2 /100 | #208 | Poor 58.1% |
| Immigrants | Middle Africa | 14.0 /100 | #209 | Poor 58.0% |
| Tsimshian | 13.5 /100 | #210 | Poor 57.9% |
| Immigrants | Nigeria | 13.3 /100 | #211 | Poor 57.9% |
| Immigrants | Senegal | 11.8 /100 | #212 | Poor 57.8% |
| French Canadians | 11.8 /100 | #213 | Poor 57.8% |
| Immigrants | Colombia | 11.6 /100 | #214 | Poor 57.8% |
| Tongans | 11.6 /100 | #215 | Poor 57.8% |
| Immigrants | Peru | 10.6 /100 | #216 | Poor 57.7% |
| Immigrants | Panama | 9.1 /100 | #217 | Tragic 57.6% |
Demographics Similar to Immigrants from Jamaica by College, 1 year or more
In terms of college, 1 year or more, the demographic groups most similar to Immigrants from Jamaica are Arapaho (54.1%, a difference of 0.020%), Cheyenne (54.1%, a difference of 0.070%), Colville (54.1%, a difference of 0.090%), Guyanese (54.1%, a difference of 0.13%), and Ecuadorian (54.3%, a difference of 0.32%).
| Demographics | Rating | Rank | College, 1 year or more |
| Bahamians | 0.2 /100 | #271 | Tragic 54.5% |
| Comanche | 0.2 /100 | #272 | Tragic 54.4% |
| Immigrants | Grenada | 0.2 /100 | #273 | Tragic 54.4% |
| Belizeans | 0.2 /100 | #274 | Tragic 54.4% |
| Americans | 0.2 /100 | #275 | Tragic 54.4% |
| Shoshone | 0.2 /100 | #276 | Tragic 54.3% |
| Ecuadorians | 0.2 /100 | #277 | Tragic 54.3% |
| Immigrants | Jamaica | 0.1 /100 | #278 | Tragic 54.2% |
| Arapaho | 0.1 /100 | #279 | Tragic 54.1% |
| Cheyenne | 0.1 /100 | #280 | Tragic 54.1% |
| Colville | 0.1 /100 | #281 | Tragic 54.1% |
| Guyanese | 0.1 /100 | #282 | Tragic 54.1% |
| Nicaraguans | 0.1 /100 | #283 | Tragic 53.9% |
| Ute | 0.1 /100 | #284 | Tragic 53.8% |
| Immigrants | Guyana | 0.1 /100 | #285 | Tragic 53.5% |