Tsimshian vs Immigrants from Jamaica College, Under 1 year
COMPARE
Tsimshian
Immigrants from Jamaica
College, Under 1 year
College, Under 1 year Comparison
Tsimshian
Immigrants from Jamaica
64.3%
COLLEGE, UNDER 1 YEAR
17.9/ 100
METRIC RATING
198th/ 347
METRIC RANK
59.7%
COLLEGE, UNDER 1 YEAR
0.0/ 100
METRIC RATING
283rd/ 347
METRIC RANK
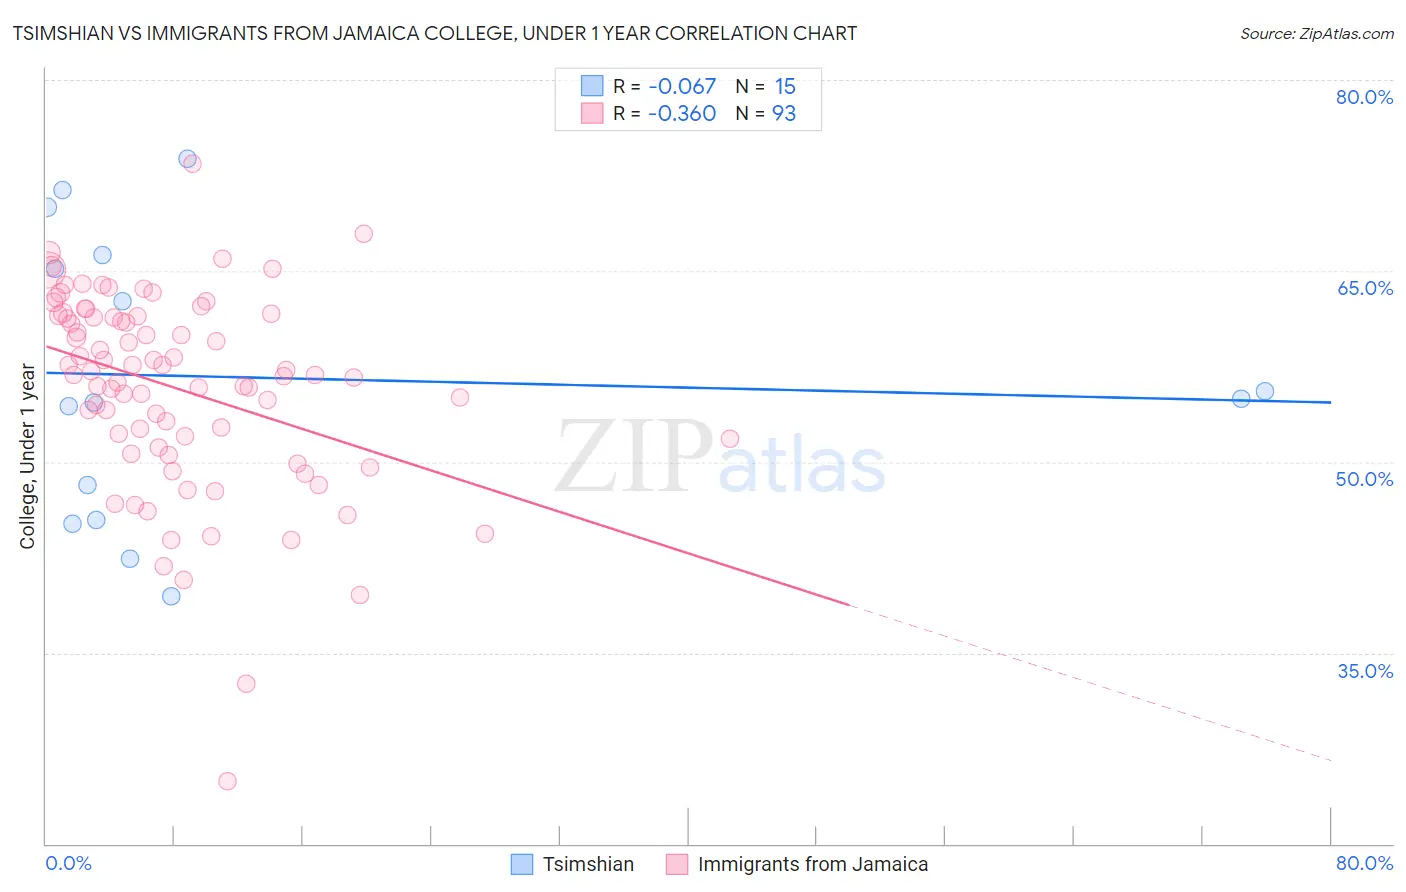
Tsimshian vs Immigrants from Jamaica College, Under 1 year Correlation Chart
The statistical analysis conducted on geographies consisting of 15,626,544 people shows a slight negative correlation between the proportion of Tsimshian and percentage of population with at least college, under 1 year education in the United States with a correlation coefficient (R) of -0.067 and weighted average of 64.3%. Similarly, the statistical analysis conducted on geographies consisting of 301,826,603 people shows a mild negative correlation between the proportion of Immigrants from Jamaica and percentage of population with at least college, under 1 year education in the United States with a correlation coefficient (R) of -0.360 and weighted average of 59.7%, a difference of 7.7%.
College, Under 1 year Correlation Summary
| Measurement | Tsimshian | Immigrants from Jamaica |
| Minimum | 39.5% | 24.9% |
| Maximum | 73.8% | 73.4% |
| Range | 34.3% | 48.5% |
| Mean | 56.6% | 55.8% |
| Median | 54.9% | 56.8% |
| Interquartile 25% (IQ1) | 45.5% | 51.5% |
| Interquartile 75% (IQ3) | 66.2% | 61.5% |
| Interquartile Range (IQR) | 20.8% | 10.0% |
| Standard Deviation (Sample) | 11.1% | 7.9% |
| Standard Deviation (Population) | 10.7% | 7.8% |
Similar Demographics by College, Under 1 year
Demographics Similar to Tsimshian by College, Under 1 year
In terms of college, under 1 year, the demographic groups most similar to Tsimshian are Panamanian (64.3%, a difference of 0.070%), Nigerian (64.3%, a difference of 0.090%), Costa Rican (64.4%, a difference of 0.13%), French Canadian (64.2%, a difference of 0.13%), and South American (64.2%, a difference of 0.13%).
| Demographics | Rating | Rank | College, Under 1 year |
| Immigrants | Armenia | 28.1 /100 | #191 | Fair 64.7% |
| Immigrants | Thailand | 27.0 /100 | #192 | Fair 64.7% |
| Slovaks | 26.7 /100 | #193 | Fair 64.7% |
| Immigrants | Cameroon | 24.6 /100 | #194 | Fair 64.6% |
| Immigrants | South Eastern Asia | 22.1 /100 | #195 | Fair 64.5% |
| Tongans | 21.2 /100 | #196 | Fair 64.5% |
| Costa Ricans | 19.6 /100 | #197 | Poor 64.4% |
| Tsimshian | 17.9 /100 | #198 | Poor 64.3% |
| Panamanians | 17.0 /100 | #199 | Poor 64.3% |
| Nigerians | 16.7 /100 | #200 | Poor 64.3% |
| French Canadians | 16.3 /100 | #201 | Poor 64.2% |
| South Americans | 16.2 /100 | #202 | Poor 64.2% |
| Uruguayans | 15.6 /100 | #203 | Poor 64.2% |
| Immigrants | Zaire | 14.6 /100 | #204 | Poor 64.1% |
| Peruvians | 13.7 /100 | #205 | Poor 64.1% |
Demographics Similar to Immigrants from Jamaica by College, Under 1 year
In terms of college, under 1 year, the demographic groups most similar to Immigrants from Jamaica are Immigrants from St. Vincent and the Grenadines (59.6%, a difference of 0.11%), Paiute (59.6%, a difference of 0.12%), British West Indian (59.5%, a difference of 0.27%), Sioux (59.4%, a difference of 0.44%), and Black/African American (59.4%, a difference of 0.54%).
| Demographics | Rating | Rank | College, Under 1 year |
| Arapaho | 0.1 /100 | #276 | Tragic 60.3% |
| Bahamians | 0.1 /100 | #277 | Tragic 60.3% |
| Yaqui | 0.1 /100 | #278 | Tragic 60.2% |
| Ute | 0.1 /100 | #279 | Tragic 60.2% |
| Crow | 0.1 /100 | #280 | Tragic 60.2% |
| Cherokee | 0.1 /100 | #281 | Tragic 60.1% |
| Belizeans | 0.1 /100 | #282 | Tragic 60.1% |
| Immigrants | Jamaica | 0.0 /100 | #283 | Tragic 59.7% |
| Immigrants | St. Vincent and the Grenadines | 0.0 /100 | #284 | Tragic 59.6% |
| Paiute | 0.0 /100 | #285 | Tragic 59.6% |
| British West Indians | 0.0 /100 | #286 | Tragic 59.5% |
| Sioux | 0.0 /100 | #287 | Tragic 59.4% |
| Blacks/African Americans | 0.0 /100 | #288 | Tragic 59.4% |
| Choctaw | 0.0 /100 | #289 | Tragic 59.3% |
| Ecuadorians | 0.0 /100 | #290 | Tragic 59.3% |