Jordanian vs Immigrants from Jamaica College, 1 year or more
COMPARE
Jordanian
Immigrants from Jamaica
College, 1 year or more
College, 1 year or more Comparison
Jordanians
Immigrants from Jamaica
62.2%
COLLEGE, 1 YEAR OR MORE
97.2/ 100
METRIC RATING
97th/ 347
METRIC RANK
54.2%
COLLEGE, 1 YEAR OR MORE
0.1/ 100
METRIC RATING
278th/ 347
METRIC RANK
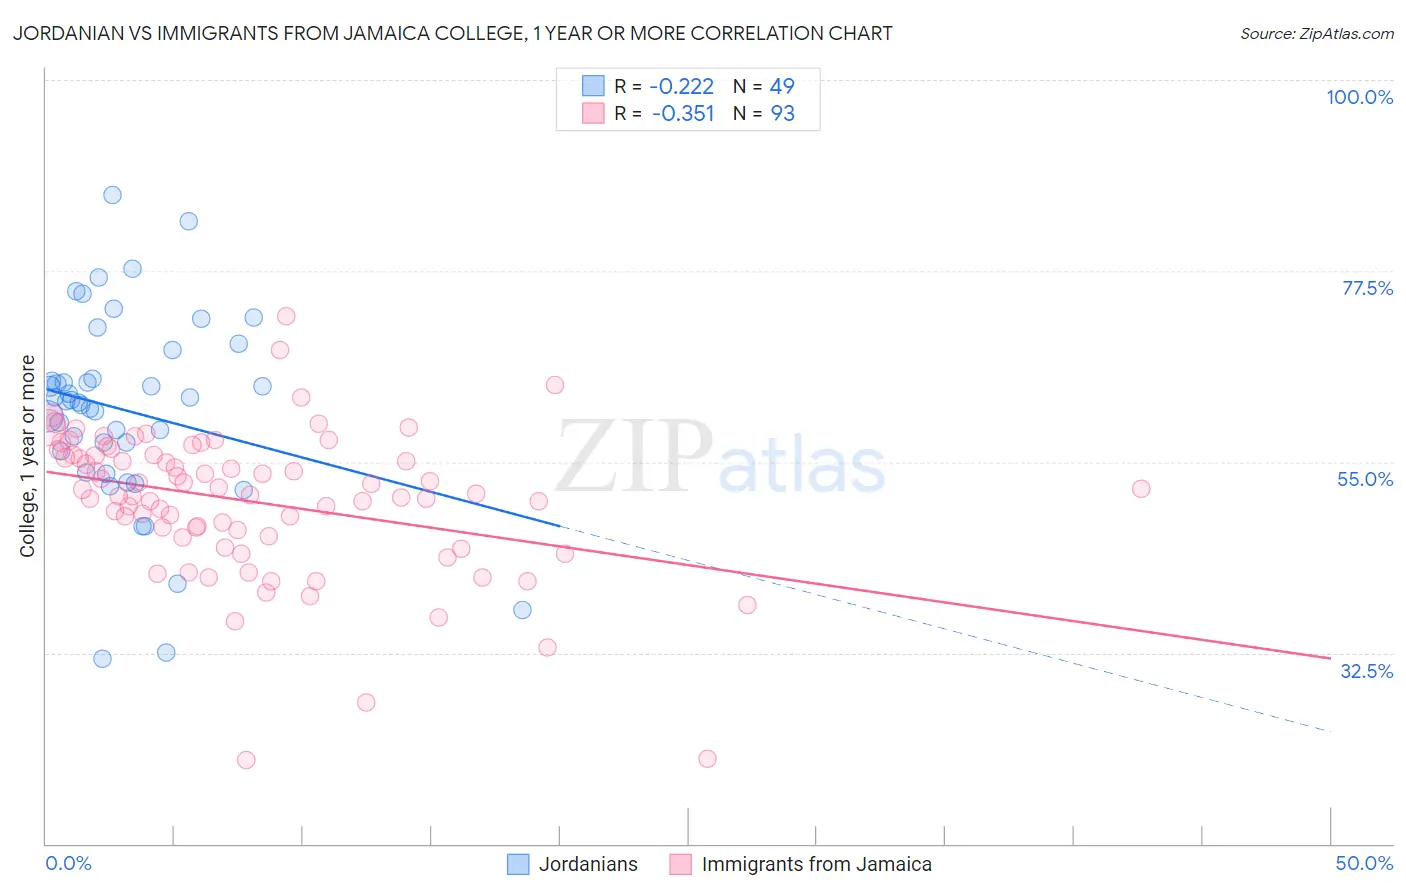
Jordanian vs Immigrants from Jamaica College, 1 year or more Correlation Chart
The statistical analysis conducted on geographies consisting of 166,424,117 people shows a weak negative correlation between the proportion of Jordanians and percentage of population with at least college, 1 year or more education in the United States with a correlation coefficient (R) of -0.222 and weighted average of 62.2%. Similarly, the statistical analysis conducted on geographies consisting of 301,826,812 people shows a mild negative correlation between the proportion of Immigrants from Jamaica and percentage of population with at least college, 1 year or more education in the United States with a correlation coefficient (R) of -0.351 and weighted average of 54.2%, a difference of 14.8%.
College, 1 year or more Correlation Summary
| Measurement | Jordanian | Immigrants from Jamaica |
| Minimum | 31.8% | 19.8% |
| Maximum | 86.4% | 72.1% |
| Range | 54.6% | 52.3% |
| Mean | 61.0% | 50.3% |
| Median | 62.1% | 51.2% |
| Interquartile 25% (IQ1) | 55.0% | 46.2% |
| Interquartile 75% (IQ3) | 66.5% | 55.9% |
| Interquartile Range (IQR) | 11.5% | 9.7% |
| Standard Deviation (Sample) | 11.4% | 8.7% |
| Standard Deviation (Population) | 11.3% | 8.7% |
Similar Demographics by College, 1 year or more
Demographics Similar to Jordanians by College, 1 year or more
In terms of college, 1 year or more, the demographic groups most similar to Jordanians are Carpatho Rusyn (62.2%, a difference of 0.0%), Chinese (62.2%, a difference of 0.010%), Croatian (62.2%, a difference of 0.010%), British (62.3%, a difference of 0.12%), and Icelander (62.1%, a difference of 0.17%).
| Demographics | Rating | Rank | College, 1 year or more |
| Immigrants | Western Asia | 97.9 /100 | #90 | Exceptional 62.5% |
| Immigrants | Eastern Europe | 97.8 /100 | #91 | Exceptional 62.4% |
| Immigrants | Egypt | 97.8 /100 | #92 | Exceptional 62.4% |
| Romanians | 97.7 /100 | #93 | Exceptional 62.4% |
| Immigrants | Croatia | 97.6 /100 | #94 | Exceptional 62.3% |
| British | 97.4 /100 | #95 | Exceptional 62.3% |
| Chinese | 97.2 /100 | #96 | Exceptional 62.2% |
| Jordanians | 97.2 /100 | #97 | Exceptional 62.2% |
| Carpatho Rusyns | 97.2 /100 | #98 | Exceptional 62.2% |
| Croatians | 97.1 /100 | #99 | Exceptional 62.2% |
| Icelanders | 96.8 /100 | #100 | Exceptional 62.1% |
| Swedes | 96.8 /100 | #101 | Exceptional 62.1% |
| Luxembourgers | 96.7 /100 | #102 | Exceptional 62.1% |
| Afghans | 96.4 /100 | #103 | Exceptional 62.0% |
| Chileans | 96.4 /100 | #104 | Exceptional 62.0% |
Demographics Similar to Immigrants from Jamaica by College, 1 year or more
In terms of college, 1 year or more, the demographic groups most similar to Immigrants from Jamaica are Arapaho (54.1%, a difference of 0.020%), Cheyenne (54.1%, a difference of 0.070%), Colville (54.1%, a difference of 0.090%), Guyanese (54.1%, a difference of 0.13%), and Ecuadorian (54.3%, a difference of 0.32%).
| Demographics | Rating | Rank | College, 1 year or more |
| Bahamians | 0.2 /100 | #271 | Tragic 54.5% |
| Comanche | 0.2 /100 | #272 | Tragic 54.4% |
| Immigrants | Grenada | 0.2 /100 | #273 | Tragic 54.4% |
| Belizeans | 0.2 /100 | #274 | Tragic 54.4% |
| Americans | 0.2 /100 | #275 | Tragic 54.4% |
| Shoshone | 0.2 /100 | #276 | Tragic 54.3% |
| Ecuadorians | 0.2 /100 | #277 | Tragic 54.3% |
| Immigrants | Jamaica | 0.1 /100 | #278 | Tragic 54.2% |
| Arapaho | 0.1 /100 | #279 | Tragic 54.1% |
| Cheyenne | 0.1 /100 | #280 | Tragic 54.1% |
| Colville | 0.1 /100 | #281 | Tragic 54.1% |
| Guyanese | 0.1 /100 | #282 | Tragic 54.1% |
| Nicaraguans | 0.1 /100 | #283 | Tragic 53.9% |
| Ute | 0.1 /100 | #284 | Tragic 53.8% |
| Immigrants | Guyana | 0.1 /100 | #285 | Tragic 53.5% |