Tsimshian vs Immigrants from Philippines College, 1 year or more
COMPARE
Tsimshian
Immigrants from Philippines
College, 1 year or more
College, 1 year or more Comparison
Tsimshian
Immigrants from Philippines
57.9%
COLLEGE, 1 YEAR OR MORE
13.5/ 100
METRIC RATING
210th/ 347
METRIC RANK
58.7%
COLLEGE, 1 YEAR OR MORE
29.2/ 100
METRIC RATING
191st/ 347
METRIC RANK
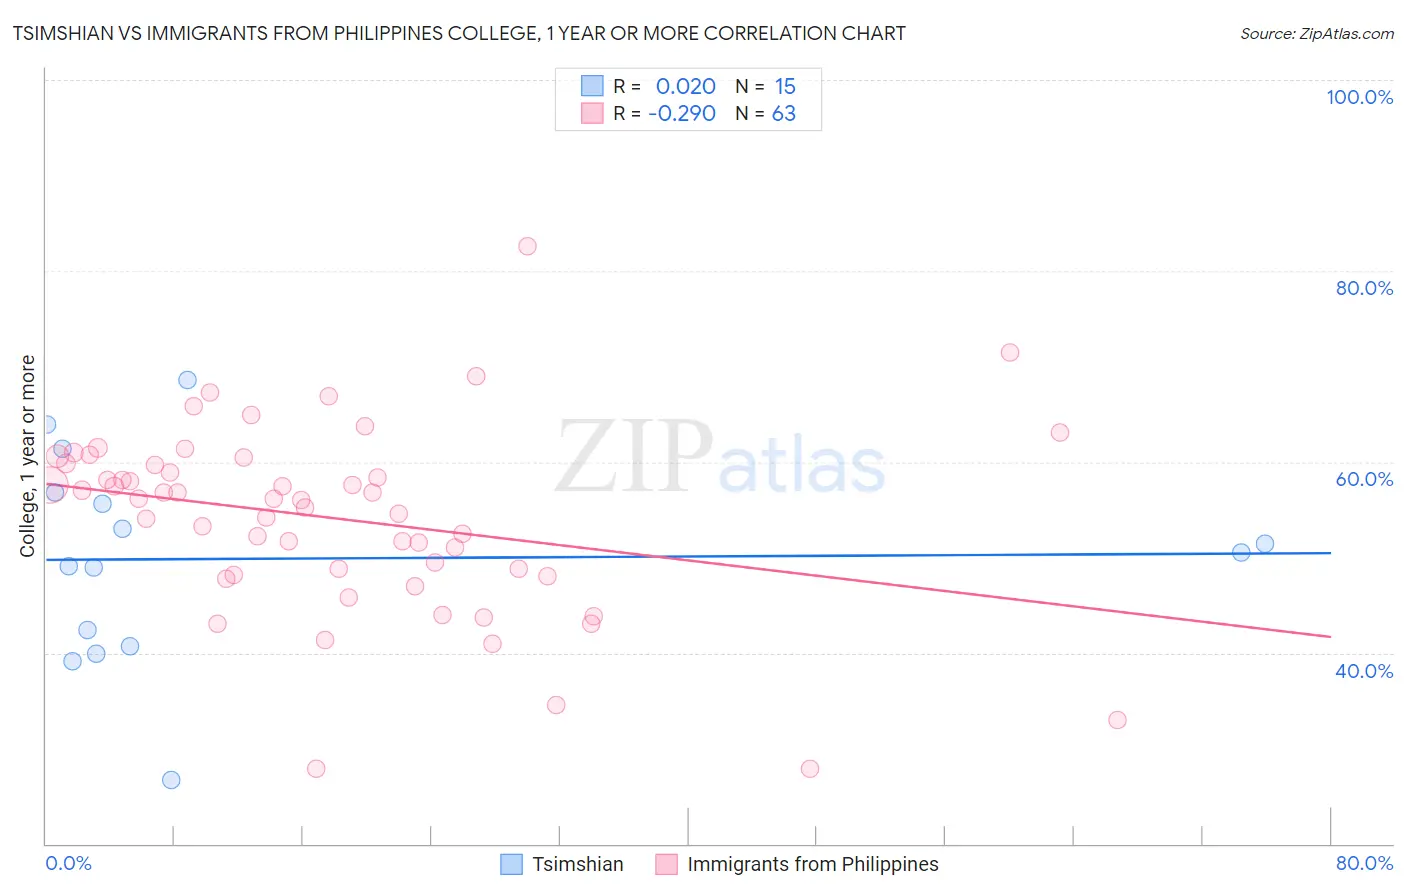
Tsimshian vs Immigrants from Philippines College, 1 year or more Correlation Chart
The statistical analysis conducted on geographies consisting of 15,626,544 people shows no correlation between the proportion of Tsimshian and percentage of population with at least college, 1 year or more education in the United States with a correlation coefficient (R) of 0.020 and weighted average of 57.9%. Similarly, the statistical analysis conducted on geographies consisting of 471,303,821 people shows a weak negative correlation between the proportion of Immigrants from Philippines and percentage of population with at least college, 1 year or more education in the United States with a correlation coefficient (R) of -0.290 and weighted average of 58.7%, a difference of 1.3%.
College, 1 year or more Correlation Summary
| Measurement | Tsimshian | Immigrants from Philippines |
| Minimum | 26.7% | 27.9% |
| Maximum | 68.6% | 82.6% |
| Range | 41.9% | 54.7% |
| Mean | 49.9% | 54.1% |
| Median | 50.5% | 56.1% |
| Interquartile 25% (IQ1) | 40.7% | 48.1% |
| Interquartile 75% (IQ3) | 56.8% | 59.9% |
| Interquartile Range (IQR) | 16.1% | 11.7% |
| Standard Deviation (Sample) | 10.9% | 9.9% |
| Standard Deviation (Population) | 10.6% | 9.8% |
Demographics Similar to Tsimshian and Immigrants from Philippines by College, 1 year or more
In terms of college, 1 year or more, the demographic groups most similar to Tsimshian are Immigrants from Middle Africa (58.0%, a difference of 0.060%), Immigrants from Uruguay (58.1%, a difference of 0.19%), Senegalese (58.2%, a difference of 0.36%), Immigrants from Vietnam (58.2%, a difference of 0.49%), and Immigrants from Zaire (58.3%, a difference of 0.53%). Similarly, the demographic groups most similar to Immigrants from Philippines are Colombian (58.7%, a difference of 0.10%), Peruvian (58.6%, a difference of 0.11%), Immigrants from Cameroon (58.8%, a difference of 0.13%), Costa Rican (58.6%, a difference of 0.18%), and Dutch (58.6%, a difference of 0.20%).
| Demographics | Rating | Rank | College, 1 year or more |
| Immigrants | Cameroon | 31.2 /100 | #190 | Fair 58.8% |
| Immigrants | Philippines | 29.2 /100 | #191 | Fair 58.7% |
| Colombians | 27.6 /100 | #192 | Fair 58.7% |
| Peruvians | 27.5 /100 | #193 | Fair 58.6% |
| Costa Ricans | 26.4 /100 | #194 | Fair 58.6% |
| Dutch | 26.2 /100 | #195 | Fair 58.6% |
| Guamanians/Chamorros | 26.2 /100 | #196 | Fair 58.6% |
| Immigrants | Thailand | 26.0 /100 | #197 | Fair 58.6% |
| Immigrants | South Eastern Asia | 25.1 /100 | #198 | Fair 58.5% |
| Slovaks | 24.6 /100 | #199 | Fair 58.5% |
| Spanish | 24.2 /100 | #200 | Fair 58.5% |
| Nigerians | 23.0 /100 | #201 | Fair 58.5% |
| Immigrants | South America | 21.9 /100 | #202 | Fair 58.4% |
| Ghanaians | 20.9 /100 | #203 | Fair 58.4% |
| Panamanians | 19.2 /100 | #204 | Poor 58.3% |
| Immigrants | Zaire | 18.7 /100 | #205 | Poor 58.3% |
| Immigrants | Vietnam | 18.2 /100 | #206 | Poor 58.2% |
| Senegalese | 16.9 /100 | #207 | Poor 58.2% |
| Immigrants | Uruguay | 15.2 /100 | #208 | Poor 58.1% |
| Immigrants | Middle Africa | 14.0 /100 | #209 | Poor 58.0% |
| Tsimshian | 13.5 /100 | #210 | Poor 57.9% |