Tsimshian vs Tlingit-Haida College, 1 year or more
COMPARE
Tsimshian
Tlingit-Haida
College, 1 year or more
College, 1 year or more Comparison
Tsimshian
Tlingit-Haida
57.9%
COLLEGE, 1 YEAR OR MORE
13.5/ 100
METRIC RATING
210th/ 347
METRIC RANK
59.4%
COLLEGE, 1 YEAR OR MORE
48.4/ 100
METRIC RATING
177th/ 347
METRIC RANK
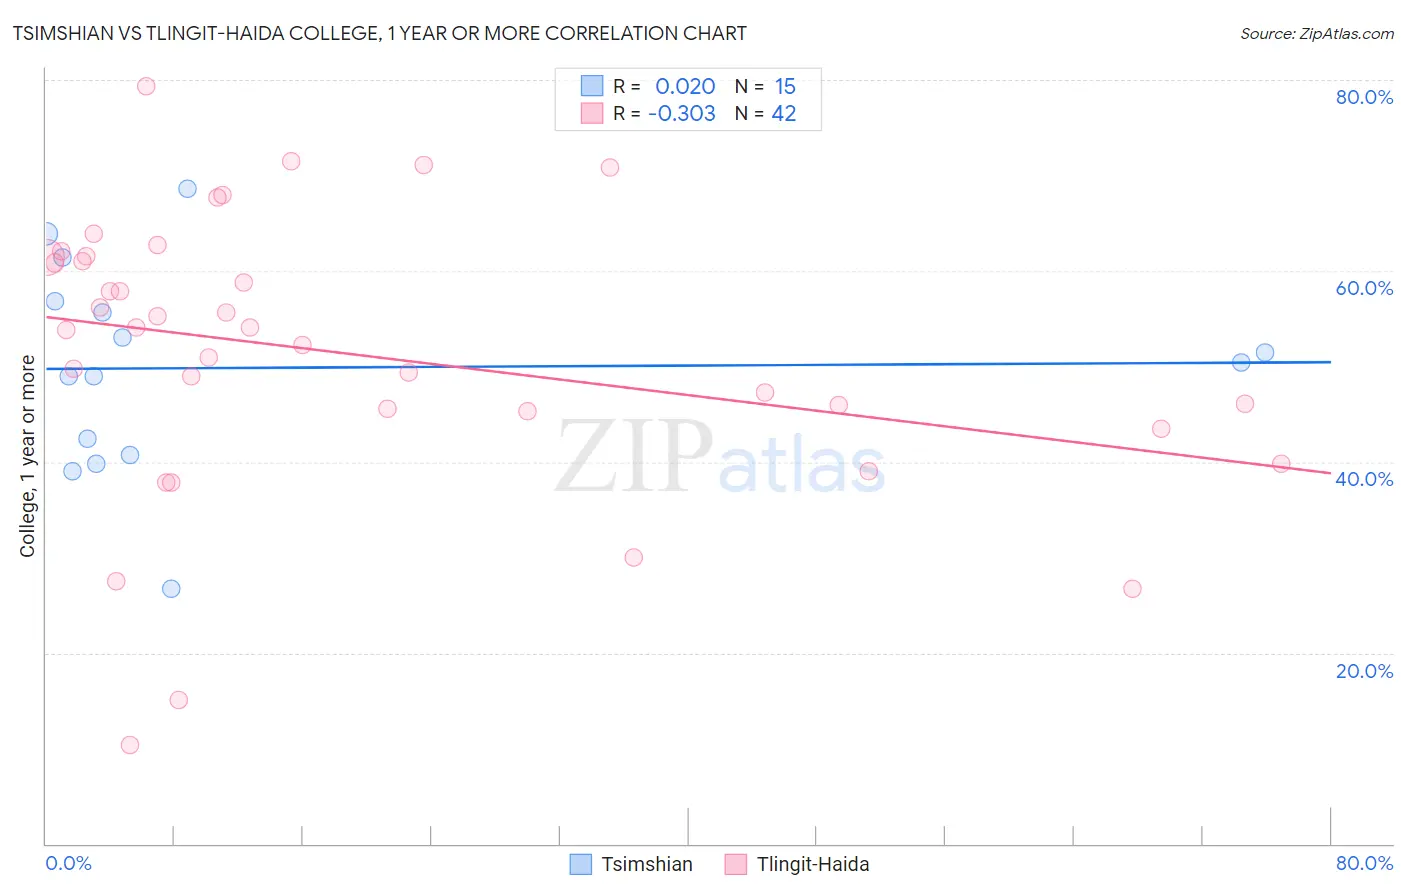
Tsimshian vs Tlingit-Haida College, 1 year or more Correlation Chart
The statistical analysis conducted on geographies consisting of 15,626,544 people shows no correlation between the proportion of Tsimshian and percentage of population with at least college, 1 year or more education in the United States with a correlation coefficient (R) of 0.020 and weighted average of 57.9%. Similarly, the statistical analysis conducted on geographies consisting of 60,872,339 people shows a mild negative correlation between the proportion of Tlingit-Haida and percentage of population with at least college, 1 year or more education in the United States with a correlation coefficient (R) of -0.303 and weighted average of 59.4%, a difference of 2.5%.
College, 1 year or more Correlation Summary
| Measurement | Tsimshian | Tlingit-Haida |
| Minimum | 26.7% | 10.3% |
| Maximum | 68.6% | 79.3% |
| Range | 41.9% | 69.0% |
| Mean | 49.9% | 51.3% |
| Median | 50.5% | 54.0% |
| Interquartile 25% (IQ1) | 40.7% | 45.3% |
| Interquartile 75% (IQ3) | 56.8% | 61.5% |
| Interquartile Range (IQR) | 16.1% | 16.1% |
| Standard Deviation (Sample) | 10.9% | 14.8% |
| Standard Deviation (Population) | 10.6% | 14.6% |
Similar Demographics by College, 1 year or more
Demographics Similar to Tsimshian by College, 1 year or more
In terms of college, 1 year or more, the demographic groups most similar to Tsimshian are Immigrants from Nigeria (57.9%, a difference of 0.020%), Immigrants from Middle Africa (58.0%, a difference of 0.060%), Immigrants from Uruguay (58.1%, a difference of 0.19%), Immigrants from Senegal (57.8%, a difference of 0.20%), and French Canadian (57.8%, a difference of 0.20%).
| Demographics | Rating | Rank | College, 1 year or more |
| Ghanaians | 20.9 /100 | #203 | Fair 58.4% |
| Panamanians | 19.2 /100 | #204 | Poor 58.3% |
| Immigrants | Zaire | 18.7 /100 | #205 | Poor 58.3% |
| Immigrants | Vietnam | 18.2 /100 | #206 | Poor 58.2% |
| Senegalese | 16.9 /100 | #207 | Poor 58.2% |
| Immigrants | Uruguay | 15.2 /100 | #208 | Poor 58.1% |
| Immigrants | Middle Africa | 14.0 /100 | #209 | Poor 58.0% |
| Tsimshian | 13.5 /100 | #210 | Poor 57.9% |
| Immigrants | Nigeria | 13.3 /100 | #211 | Poor 57.9% |
| Immigrants | Senegal | 11.8 /100 | #212 | Poor 57.8% |
| French Canadians | 11.8 /100 | #213 | Poor 57.8% |
| Immigrants | Colombia | 11.6 /100 | #214 | Poor 57.8% |
| Tongans | 11.6 /100 | #215 | Poor 57.8% |
| Immigrants | Peru | 10.6 /100 | #216 | Poor 57.7% |
| Immigrants | Panama | 9.1 /100 | #217 | Tragic 57.6% |
Demographics Similar to Tlingit-Haida by College, 1 year or more
In terms of college, 1 year or more, the demographic groups most similar to Tlingit-Haida are Czechoslovakian (59.4%, a difference of 0.0%), Sri Lankan (59.4%, a difference of 0.030%), Immigrants from Poland (59.4%, a difference of 0.030%), Celtic (59.4%, a difference of 0.080%), and Bermudan (59.3%, a difference of 0.10%).
| Demographics | Rating | Rank | College, 1 year or more |
| Welsh | 52.4 /100 | #170 | Average 59.5% |
| Immigrants | Albania | 52.3 /100 | #171 | Average 59.5% |
| Immigrants | Sierra Leone | 52.2 /100 | #172 | Average 59.5% |
| Immigrants | Oceania | 51.2 /100 | #173 | Average 59.4% |
| Celtics | 50.0 /100 | #174 | Average 59.4% |
| Sri Lankans | 49.0 /100 | #175 | Average 59.4% |
| Immigrants | Poland | 48.9 /100 | #176 | Average 59.4% |
| Tlingit-Haida | 48.4 /100 | #177 | Average 59.4% |
| Czechoslovakians | 48.3 /100 | #178 | Average 59.4% |
| Bermudans | 46.6 /100 | #179 | Average 59.3% |
| Yugoslavians | 44.1 /100 | #180 | Average 59.2% |
| Swiss | 43.4 /100 | #181 | Average 59.2% |
| Immigrants | Bosnia and Herzegovina | 42.8 /100 | #182 | Average 59.2% |
| German Russians | 39.3 /100 | #183 | Fair 59.1% |
| Spaniards | 38.3 /100 | #184 | Fair 59.0% |