Tsimshian vs Immigrants from Belgium GED/Equivalency
COMPARE
Tsimshian
Immigrants from Belgium
GED/Equivalency
GED/Equivalency Comparison
Tsimshian
Immigrants from Belgium
86.6%
GED/EQUIVALENCY
88.3/ 100
METRIC RATING
133rd/ 347
METRIC RANK
88.3%
GED/EQUIVALENCY
99.7/ 100
METRIC RATING
36th/ 347
METRIC RANK
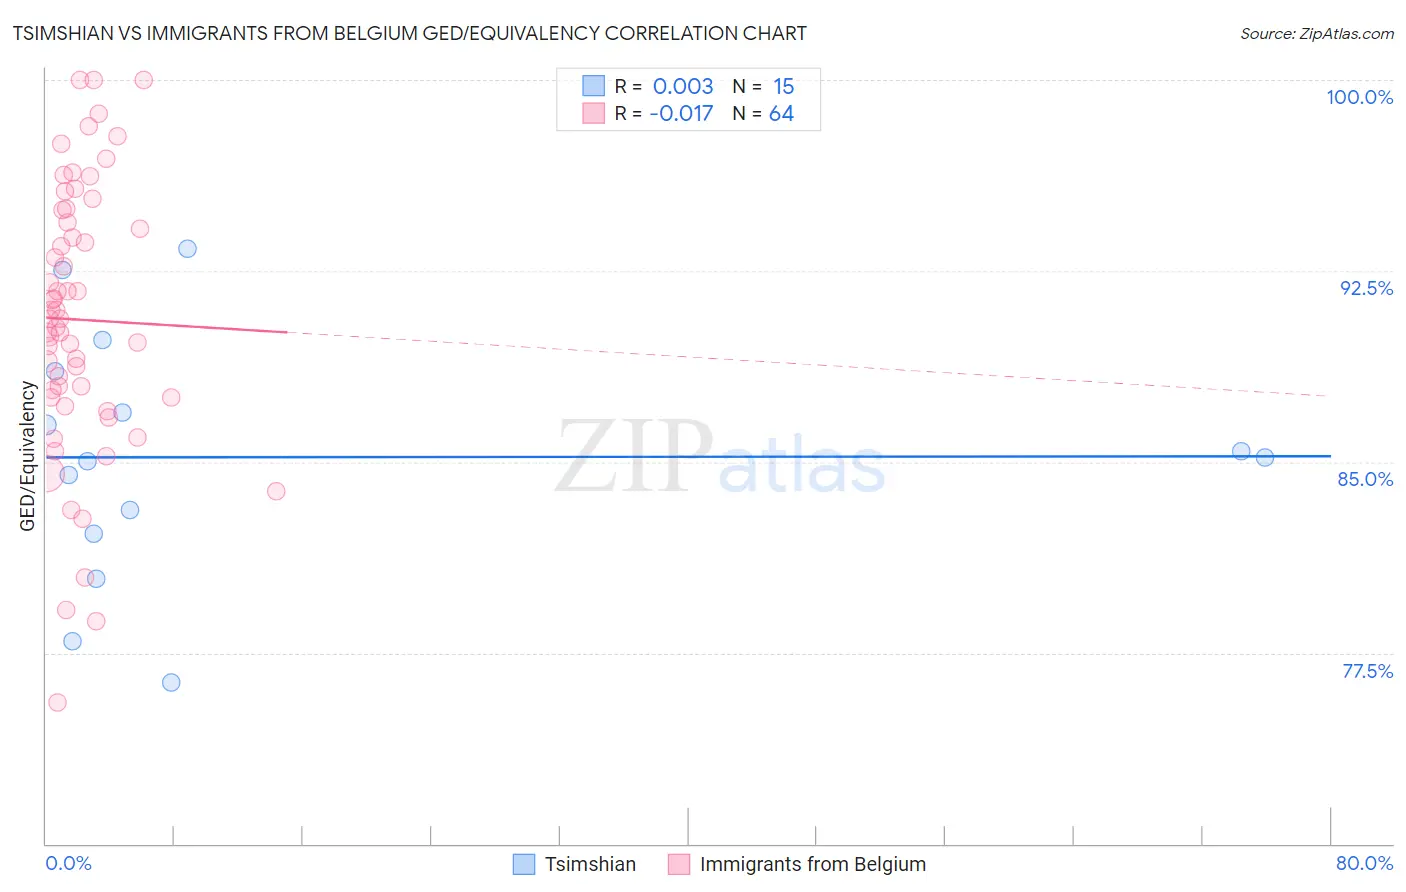
Tsimshian vs Immigrants from Belgium GED/Equivalency Correlation Chart
The statistical analysis conducted on geographies consisting of 15,626,544 people shows no correlation between the proportion of Tsimshian and percentage of population with at least ged/equivalency education in the United States with a correlation coefficient (R) of 0.003 and weighted average of 86.6%. Similarly, the statistical analysis conducted on geographies consisting of 146,727,159 people shows no correlation between the proportion of Immigrants from Belgium and percentage of population with at least ged/equivalency education in the United States with a correlation coefficient (R) of -0.017 and weighted average of 88.3%, a difference of 2.0%.
GED/Equivalency Correlation Summary
| Measurement | Tsimshian | Immigrants from Belgium |
| Minimum | 76.3% | 75.5% |
| Maximum | 93.4% | 100.0% |
| Range | 17.1% | 24.5% |
| Mean | 85.2% | 90.6% |
| Median | 85.2% | 90.6% |
| Interquartile 25% (IQ1) | 82.2% | 87.5% |
| Interquartile 75% (IQ3) | 88.6% | 94.6% |
| Interquartile Range (IQR) | 6.4% | 7.1% |
| Standard Deviation (Sample) | 4.8% | 5.4% |
| Standard Deviation (Population) | 4.7% | 5.3% |
Similar Demographics by GED/Equivalency
Demographics Similar to Tsimshian by GED/Equivalency
In terms of ged/equivalency, the demographic groups most similar to Tsimshian are Immigrants from Brazil (86.6%, a difference of 0.0%), Immigrants from Spain (86.7%, a difference of 0.010%), Immigrants from Ukraine (86.7%, a difference of 0.030%), Immigrants from Germany (86.7%, a difference of 0.030%), and Albanian (86.6%, a difference of 0.030%).
| Demographics | Rating | Rank | GED/Equivalency |
| Asians | 90.3 /100 | #126 | Exceptional 86.7% |
| Argentineans | 89.7 /100 | #127 | Excellent 86.7% |
| Yugoslavians | 89.5 /100 | #128 | Excellent 86.7% |
| Immigrants | Ukraine | 88.9 /100 | #129 | Excellent 86.7% |
| Immigrants | Germany | 88.8 /100 | #130 | Excellent 86.7% |
| Immigrants | Spain | 88.5 /100 | #131 | Excellent 86.7% |
| Immigrants | Brazil | 88.4 /100 | #132 | Excellent 86.6% |
| Tsimshian | 88.3 /100 | #133 | Excellent 86.6% |
| Albanians | 87.7 /100 | #134 | Excellent 86.6% |
| Immigrants | Asia | 87.4 /100 | #135 | Excellent 86.6% |
| Chileans | 86.9 /100 | #136 | Excellent 86.6% |
| Arabs | 86.7 /100 | #137 | Excellent 86.6% |
| Immigrants | Argentina | 86.5 /100 | #138 | Excellent 86.6% |
| Immigrants | Malaysia | 85.0 /100 | #139 | Excellent 86.5% |
| Paraguayans | 84.1 /100 | #140 | Excellent 86.5% |
Demographics Similar to Immigrants from Belgium by GED/Equivalency
In terms of ged/equivalency, the demographic groups most similar to Immigrants from Belgium are Immigrants from South Central Asia (88.4%, a difference of 0.020%), Immigrants from Austria (88.3%, a difference of 0.030%), Immigrants from Japan (88.4%, a difference of 0.040%), Immigrants from Sweden (88.4%, a difference of 0.050%), and Burmese (88.3%, a difference of 0.060%).
| Demographics | Rating | Rank | GED/Equivalency |
| Poles | 99.8 /100 | #29 | Exceptional 88.5% |
| Turks | 99.8 /100 | #30 | Exceptional 88.5% |
| Bhutanese | 99.8 /100 | #31 | Exceptional 88.4% |
| Danes | 99.8 /100 | #32 | Exceptional 88.4% |
| Immigrants | Sweden | 99.7 /100 | #33 | Exceptional 88.4% |
| Immigrants | Japan | 99.7 /100 | #34 | Exceptional 88.4% |
| Immigrants | South Central Asia | 99.7 /100 | #35 | Exceptional 88.4% |
| Immigrants | Belgium | 99.7 /100 | #36 | Exceptional 88.3% |
| Immigrants | Austria | 99.7 /100 | #37 | Exceptional 88.3% |
| Burmese | 99.7 /100 | #38 | Exceptional 88.3% |
| Immigrants | Israel | 99.6 /100 | #39 | Exceptional 88.2% |
| Italians | 99.6 /100 | #40 | Exceptional 88.2% |
| Finns | 99.6 /100 | #41 | Exceptional 88.2% |
| Cambodians | 99.6 /100 | #42 | Exceptional 88.2% |
| Immigrants | Scotland | 99.6 /100 | #43 | Exceptional 88.2% |