Tsimshian vs Immigrants from El Salvador GED/Equivalency
COMPARE
Tsimshian
Immigrants from El Salvador
GED/Equivalency
GED/Equivalency Comparison
Tsimshian
Immigrants from El Salvador
86.6%
GED/EQUIVALENCY
88.3/ 100
METRIC RATING
133rd/ 347
METRIC RANK
77.6%
GED/EQUIVALENCY
0.0/ 100
METRIC RATING
339th/ 347
METRIC RANK
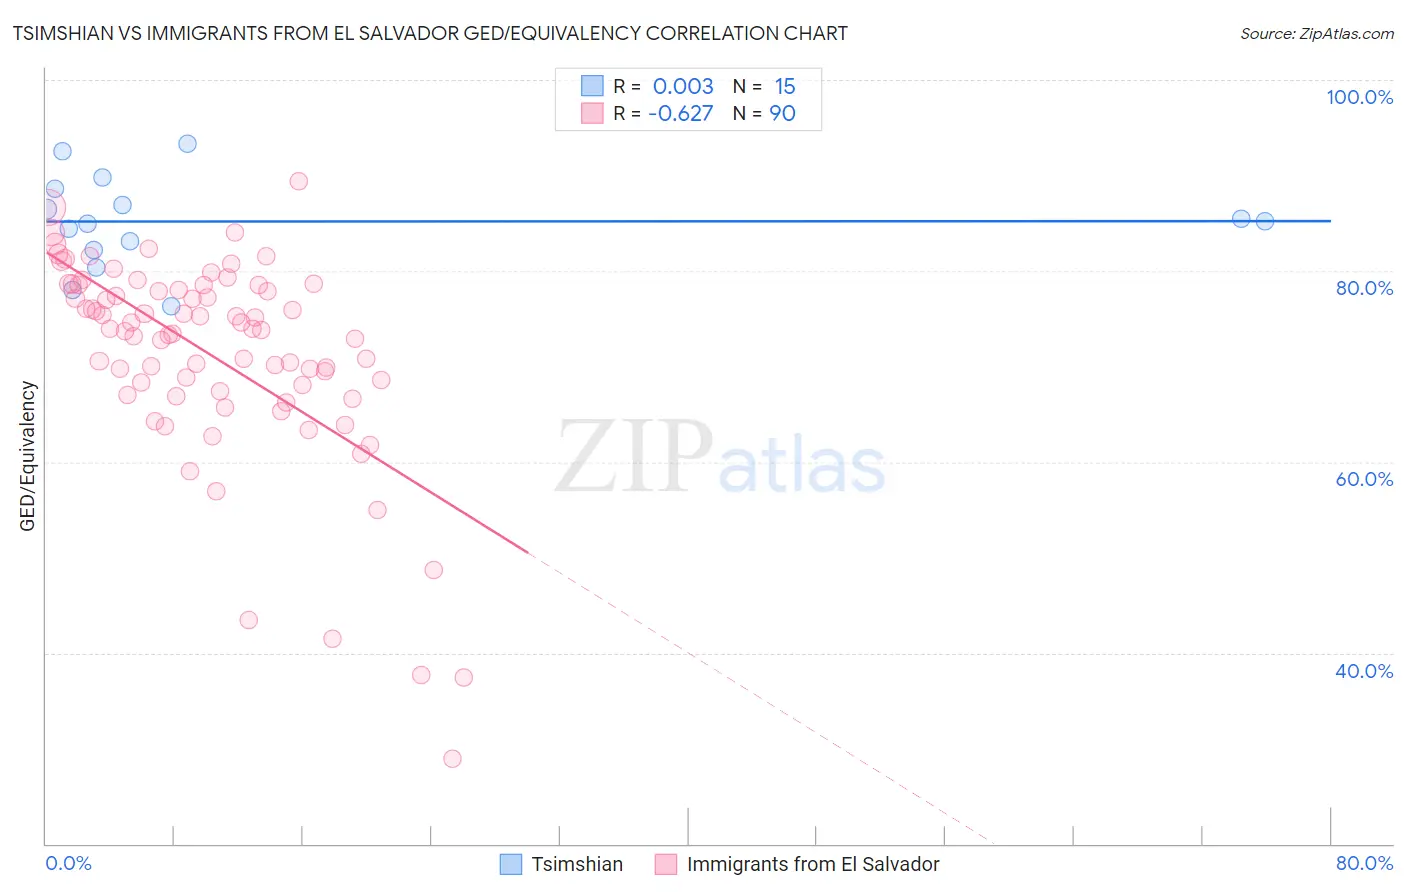
Tsimshian vs Immigrants from El Salvador GED/Equivalency Correlation Chart
The statistical analysis conducted on geographies consisting of 15,626,544 people shows no correlation between the proportion of Tsimshian and percentage of population with at least ged/equivalency education in the United States with a correlation coefficient (R) of 0.003 and weighted average of 86.6%. Similarly, the statistical analysis conducted on geographies consisting of 357,852,938 people shows a significant negative correlation between the proportion of Immigrants from El Salvador and percentage of population with at least ged/equivalency education in the United States with a correlation coefficient (R) of -0.627 and weighted average of 77.6%, a difference of 11.6%.
GED/Equivalency Correlation Summary
| Measurement | Tsimshian | Immigrants from El Salvador |
| Minimum | 76.3% | 29.0% |
| Maximum | 93.4% | 89.4% |
| Range | 17.1% | 60.4% |
| Mean | 85.2% | 71.2% |
| Median | 85.2% | 73.8% |
| Interquartile 25% (IQ1) | 82.2% | 67.4% |
| Interquartile 75% (IQ3) | 88.6% | 78.5% |
| Interquartile Range (IQR) | 6.4% | 11.1% |
| Standard Deviation (Sample) | 4.8% | 10.9% |
| Standard Deviation (Population) | 4.7% | 10.8% |
Similar Demographics by GED/Equivalency
Demographics Similar to Tsimshian by GED/Equivalency
In terms of ged/equivalency, the demographic groups most similar to Tsimshian are Immigrants from Brazil (86.6%, a difference of 0.0%), Immigrants from Spain (86.7%, a difference of 0.010%), Immigrants from Ukraine (86.7%, a difference of 0.030%), Immigrants from Germany (86.7%, a difference of 0.030%), and Albanian (86.6%, a difference of 0.030%).
| Demographics | Rating | Rank | GED/Equivalency |
| Asians | 90.3 /100 | #126 | Exceptional 86.7% |
| Argentineans | 89.7 /100 | #127 | Excellent 86.7% |
| Yugoslavians | 89.5 /100 | #128 | Excellent 86.7% |
| Immigrants | Ukraine | 88.9 /100 | #129 | Excellent 86.7% |
| Immigrants | Germany | 88.8 /100 | #130 | Excellent 86.7% |
| Immigrants | Spain | 88.5 /100 | #131 | Excellent 86.7% |
| Immigrants | Brazil | 88.4 /100 | #132 | Excellent 86.6% |
| Tsimshian | 88.3 /100 | #133 | Excellent 86.6% |
| Albanians | 87.7 /100 | #134 | Excellent 86.6% |
| Immigrants | Asia | 87.4 /100 | #135 | Excellent 86.6% |
| Chileans | 86.9 /100 | #136 | Excellent 86.6% |
| Arabs | 86.7 /100 | #137 | Excellent 86.6% |
| Immigrants | Argentina | 86.5 /100 | #138 | Excellent 86.6% |
| Immigrants | Malaysia | 85.0 /100 | #139 | Excellent 86.5% |
| Paraguayans | 84.1 /100 | #140 | Excellent 86.5% |
Demographics Similar to Immigrants from El Salvador by GED/Equivalency
In terms of ged/equivalency, the demographic groups most similar to Immigrants from El Salvador are Tohono O'odham (77.5%, a difference of 0.16%), Mexican (77.4%, a difference of 0.24%), Immigrants from Guatemala (77.9%, a difference of 0.38%), Immigrants from Yemen (77.9%, a difference of 0.41%), and Immigrants from Dominican Republic (78.0%, a difference of 0.47%).
| Demographics | Rating | Rank | GED/Equivalency |
| Immigrants | Azores | 0.0 /100 | #332 | Tragic 78.7% |
| Salvadorans | 0.0 /100 | #333 | Tragic 78.6% |
| Guatemalans | 0.0 /100 | #334 | Tragic 78.5% |
| Immigrants | Latin America | 0.0 /100 | #335 | Tragic 78.5% |
| Immigrants | Dominican Republic | 0.0 /100 | #336 | Tragic 78.0% |
| Immigrants | Yemen | 0.0 /100 | #337 | Tragic 77.9% |
| Immigrants | Guatemala | 0.0 /100 | #338 | Tragic 77.9% |
| Immigrants | El Salvador | 0.0 /100 | #339 | Tragic 77.6% |
| Tohono O'odham | 0.0 /100 | #340 | Tragic 77.5% |
| Mexicans | 0.0 /100 | #341 | Tragic 77.4% |
| Pima | 0.0 /100 | #342 | Tragic 76.4% |
| Immigrants | Central America | 0.0 /100 | #343 | Tragic 76.4% |
| Spanish American Indians | 0.0 /100 | #344 | Tragic 76.3% |
| Immigrants | Mexico | 0.0 /100 | #345 | Tragic 75.7% |
| Houma | 0.0 /100 | #346 | Tragic 75.0% |