Tsimshian vs Immigrants from Belgium In Labor Force | Age 25-29
COMPARE
Tsimshian
Immigrants from Belgium
In Labor Force | Age 25-29
In Labor Force | Age 25-29 Comparison
Tsimshian
Immigrants from Belgium
88.7%
IN LABOR FORCE | AGE 25-29
100.0/ 100
METRIC RATING
1st/ 347
METRIC RANK
84.6%
IN LABOR FORCE | AGE 25-29
35.0/ 100
METRIC RATING
186th/ 347
METRIC RANK
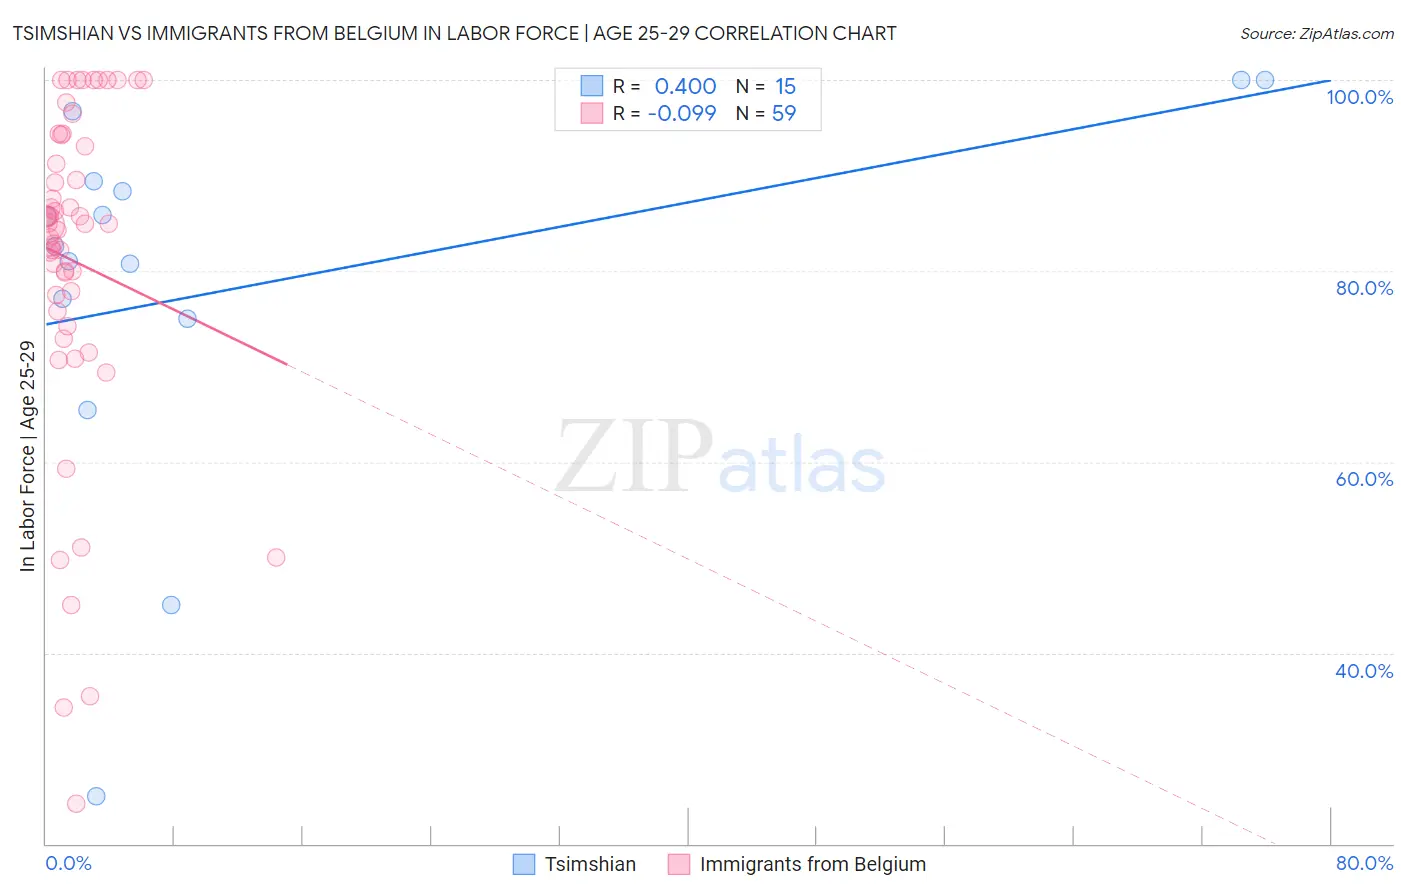
Tsimshian vs Immigrants from Belgium In Labor Force | Age 25-29 Correlation Chart
The statistical analysis conducted on geographies consisting of 15,624,837 people shows a mild positive correlation between the proportion of Tsimshian and labor force participation rate among population between the ages 25 and 29 in the United States with a correlation coefficient (R) of 0.400 and weighted average of 88.7%. Similarly, the statistical analysis conducted on geographies consisting of 146,686,004 people shows a slight negative correlation between the proportion of Immigrants from Belgium and labor force participation rate among population between the ages 25 and 29 in the United States with a correlation coefficient (R) of -0.099 and weighted average of 84.6%, a difference of 4.9%.
In Labor Force | Age 25-29 Correlation Summary
| Measurement | Tsimshian | Immigrants from Belgium |
| Minimum | 25.0% | 24.2% |
| Maximum | 100.0% | 100.0% |
| Range | 75.0% | 75.8% |
| Mean | 78.5% | 81.0% |
| Median | 82.5% | 85.0% |
| Interquartile 25% (IQ1) | 75.0% | 75.8% |
| Interquartile 75% (IQ3) | 89.4% | 94.2% |
| Interquartile Range (IQR) | 14.4% | 18.4% |
| Standard Deviation (Sample) | 20.3% | 17.6% |
| Standard Deviation (Population) | 19.6% | 17.5% |
Similar Demographics by In Labor Force | Age 25-29
Demographics Similar to Tsimshian by In Labor Force | Age 25-29
In terms of in labor force | age 25-29, the demographic groups most similar to Tsimshian are Immigrants from Somalia (87.1%, a difference of 1.8%), Somali (87.1%, a difference of 1.8%), Carpatho Rusyn (87.0%, a difference of 1.9%), Luxembourger (86.9%, a difference of 2.0%), and Slovene (86.4%, a difference of 2.7%).
| Demographics | Rating | Rank | In Labor Force | Age 25-29 |
| Tsimshian | 100.0 /100 | #1 | Exceptional 88.7% |
| Immigrants | Somalia | 100.0 /100 | #2 | Exceptional 87.1% |
| Somalis | 100.0 /100 | #3 | Exceptional 87.1% |
| Carpatho Rusyns | 100.0 /100 | #4 | Exceptional 87.0% |
| Luxembourgers | 100.0 /100 | #5 | Exceptional 86.9% |
| Slovenes | 100.0 /100 | #6 | Exceptional 86.4% |
| Immigrants | Bosnia and Herzegovina | 100.0 /100 | #7 | Exceptional 86.3% |
| Immigrants | Cabo Verde | 100.0 /100 | #8 | Exceptional 86.2% |
| Ethiopians | 100.0 /100 | #9 | Exceptional 86.2% |
| Liberians | 100.0 /100 | #10 | Exceptional 86.1% |
| Immigrants | Ethiopia | 100.0 /100 | #11 | Exceptional 86.1% |
| Immigrants | Lithuania | 100.0 /100 | #12 | Exceptional 86.1% |
| Norwegians | 100.0 /100 | #13 | Exceptional 86.1% |
| Latvians | 100.0 /100 | #14 | Exceptional 86.1% |
| Bolivians | 100.0 /100 | #15 | Exceptional 86.1% |
Demographics Similar to Immigrants from Belgium by In Labor Force | Age 25-29
In terms of in labor force | age 25-29, the demographic groups most similar to Immigrants from Belgium are Immigrants from Portugal (84.6%, a difference of 0.0%), Immigrants from Ukraine (84.5%, a difference of 0.010%), Immigrants from Denmark (84.6%, a difference of 0.020%), Moroccan (84.5%, a difference of 0.020%), and Immigrants from Kuwait (84.6%, a difference of 0.030%).
| Demographics | Rating | Rank | In Labor Force | Age 25-29 |
| Immigrants | Argentina | 44.0 /100 | #179 | Average 84.6% |
| Immigrants | South America | 42.9 /100 | #180 | Average 84.6% |
| Immigrants | Norway | 41.9 /100 | #181 | Average 84.6% |
| Europeans | 40.3 /100 | #182 | Average 84.6% |
| Scottish | 40.1 /100 | #183 | Average 84.6% |
| Immigrants | Kuwait | 38.2 /100 | #184 | Fair 84.6% |
| Immigrants | Denmark | 37.0 /100 | #185 | Fair 84.6% |
| Immigrants | Belgium | 35.0 /100 | #186 | Fair 84.6% |
| Immigrants | Portugal | 34.7 /100 | #187 | Fair 84.6% |
| Immigrants | Ukraine | 33.7 /100 | #188 | Fair 84.5% |
| Moroccans | 32.6 /100 | #189 | Fair 84.5% |
| Welsh | 31.1 /100 | #190 | Fair 84.5% |
| Zimbabweans | 28.7 /100 | #191 | Fair 84.5% |
| English | 25.8 /100 | #192 | Fair 84.5% |
| South American Indians | 25.0 /100 | #193 | Fair 84.5% |