Tsimshian vs Immigrants from Belgium Professional Degree
COMPARE
Tsimshian
Immigrants from Belgium
Professional Degree
Professional Degree Comparison
Tsimshian
Immigrants from Belgium
3.2%
PROFESSIONAL DEGREE
0.0/ 100
METRIC RATING
321st/ 347
METRIC RANK
7.0%
PROFESSIONAL DEGREE
100.0/ 100
METRIC RATING
10th/ 347
METRIC RANK
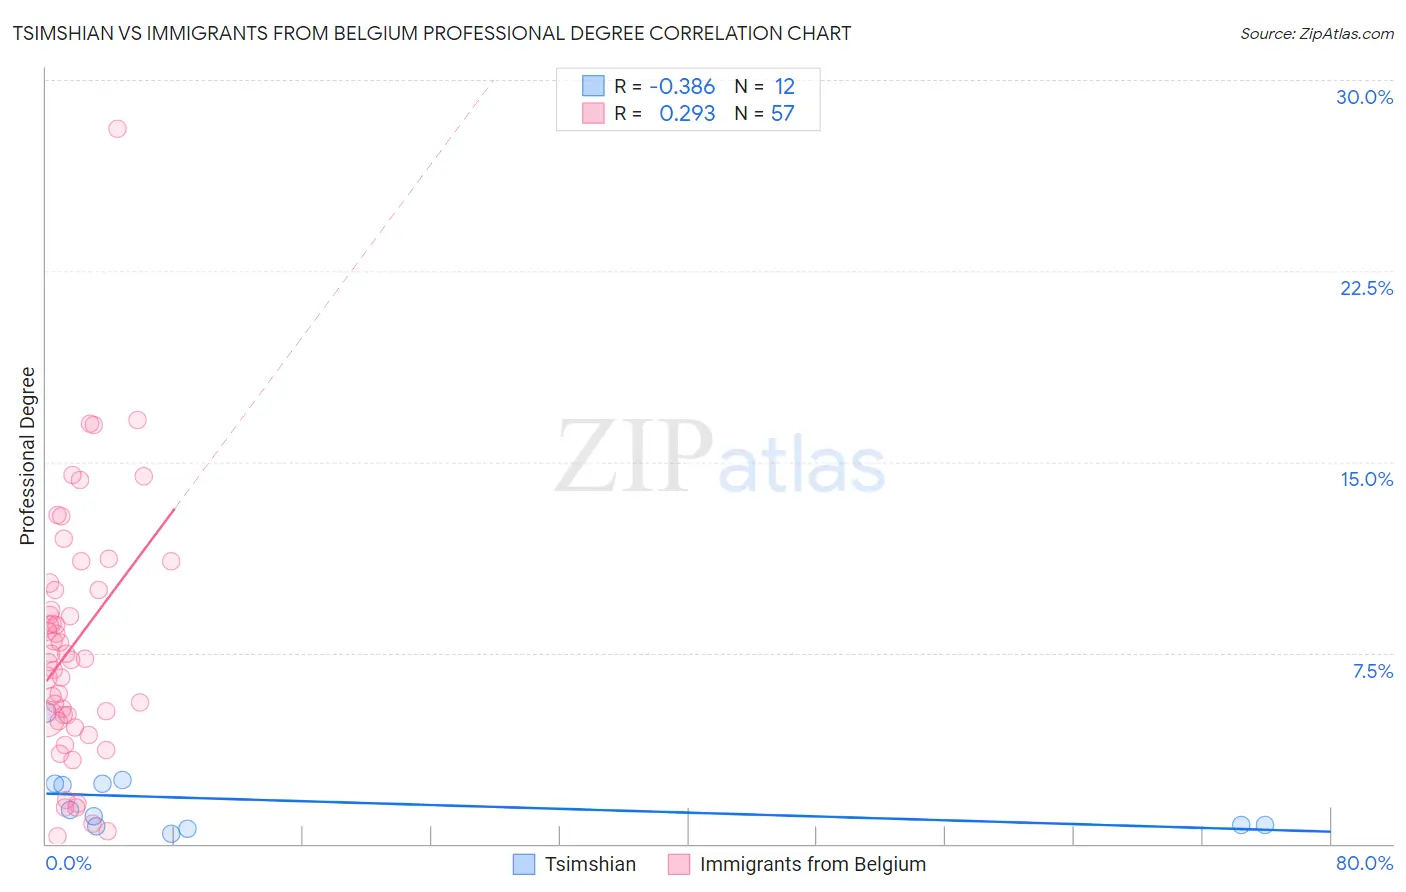
Tsimshian vs Immigrants from Belgium Professional Degree Correlation Chart
The statistical analysis conducted on geographies consisting of 15,614,727 people shows a mild negative correlation between the proportion of Tsimshian and percentage of population with at least professional degree education in the United States with a correlation coefficient (R) of -0.386 and weighted average of 3.2%. Similarly, the statistical analysis conducted on geographies consisting of 146,639,976 people shows a weak positive correlation between the proportion of Immigrants from Belgium and percentage of population with at least professional degree education in the United States with a correlation coefficient (R) of 0.293 and weighted average of 7.0%, a difference of 118.5%.
Professional Degree Correlation Summary
| Measurement | Tsimshian | Immigrants from Belgium |
| Minimum | 0.38% | 0.30% |
| Maximum | 5.2% | 28.1% |
| Range | 4.8% | 27.8% |
| Mean | 1.7% | 7.9% |
| Median | 1.2% | 7.3% |
| Interquartile 25% (IQ1) | 0.71% | 4.9% |
| Interquartile 75% (IQ3) | 2.4% | 10.1% |
| Interquartile Range (IQR) | 1.6% | 5.2% |
| Standard Deviation (Sample) | 1.4% | 5.0% |
| Standard Deviation (Population) | 1.3% | 4.9% |
Similar Demographics by Professional Degree
Demographics Similar to Tsimshian by Professional Degree
In terms of professional degree, the demographic groups most similar to Tsimshian are Seminole (3.2%, a difference of 0.36%), Hispanic or Latino (3.2%, a difference of 0.36%), Inupiat (3.2%, a difference of 0.44%), Crow (3.2%, a difference of 0.72%), and Yaqui (3.2%, a difference of 0.78%).
| Demographics | Rating | Rank | Professional Degree |
| Mexican American Indians | 0.1 /100 | #314 | Tragic 3.3% |
| Immigrants | Laos | 0.1 /100 | #315 | Tragic 3.2% |
| Puerto Ricans | 0.1 /100 | #316 | Tragic 3.2% |
| Nepalese | 0.1 /100 | #317 | Tragic 3.2% |
| Immigrants | Micronesia | 0.1 /100 | #318 | Tragic 3.2% |
| Choctaw | 0.1 /100 | #319 | Tragic 3.2% |
| Seminole | 0.1 /100 | #320 | Tragic 3.2% |
| Tsimshian | 0.0 /100 | #321 | Tragic 3.2% |
| Hispanics or Latinos | 0.0 /100 | #322 | Tragic 3.2% |
| Inupiat | 0.0 /100 | #323 | Tragic 3.2% |
| Crow | 0.0 /100 | #324 | Tragic 3.2% |
| Yaqui | 0.0 /100 | #325 | Tragic 3.2% |
| Menominee | 0.0 /100 | #326 | Tragic 3.1% |
| Dutch West Indians | 0.0 /100 | #327 | Tragic 3.1% |
| Creek | 0.0 /100 | #328 | Tragic 3.1% |
Demographics Similar to Immigrants from Belgium by Professional Degree
In terms of professional degree, the demographic groups most similar to Immigrants from Belgium are Cypriot (6.9%, a difference of 0.17%), Israeli (6.9%, a difference of 0.24%), Immigrants from Australia (6.9%, a difference of 0.66%), Immigrants from Taiwan (7.1%, a difference of 1.7%), and Immigrants from Switzerland (7.1%, a difference of 1.9%).
| Demographics | Rating | Rank | Professional Degree |
| Iranians | 100.0 /100 | #3 | Exceptional 7.6% |
| Filipinos | 100.0 /100 | #4 | Exceptional 7.6% |
| Immigrants | Iran | 100.0 /100 | #5 | Exceptional 7.3% |
| Okinawans | 100.0 /100 | #6 | Exceptional 7.3% |
| Eastern Europeans | 100.0 /100 | #7 | Exceptional 7.1% |
| Immigrants | Switzerland | 100.0 /100 | #8 | Exceptional 7.1% |
| Immigrants | Taiwan | 100.0 /100 | #9 | Exceptional 7.1% |
| Immigrants | Belgium | 100.0 /100 | #10 | Exceptional 7.0% |
| Cypriots | 100.0 /100 | #11 | Exceptional 6.9% |
| Israelis | 100.0 /100 | #12 | Exceptional 6.9% |
| Immigrants | Australia | 100.0 /100 | #13 | Exceptional 6.9% |
| Immigrants | France | 100.0 /100 | #14 | Exceptional 6.8% |
| Immigrants | China | 100.0 /100 | #15 | Exceptional 6.7% |
| Immigrants | Sweden | 100.0 /100 | #16 | Exceptional 6.7% |
| Immigrants | Eastern Asia | 100.0 /100 | #17 | Exceptional 6.6% |