Trinidadian and Tobagonian vs Czech College, 1 year or more
COMPARE
Trinidadian and Tobagonian
Czech
College, 1 year or more
College, 1 year or more Comparison
Trinidadians and Tobagonians
Czechs
55.8%
COLLEGE, 1 YEAR OR MORE
1.1/ 100
METRIC RATING
240th/ 347
METRIC RANK
60.6%
COLLEGE, 1 YEAR OR MORE
81.9/ 100
METRIC RATING
144th/ 347
METRIC RANK
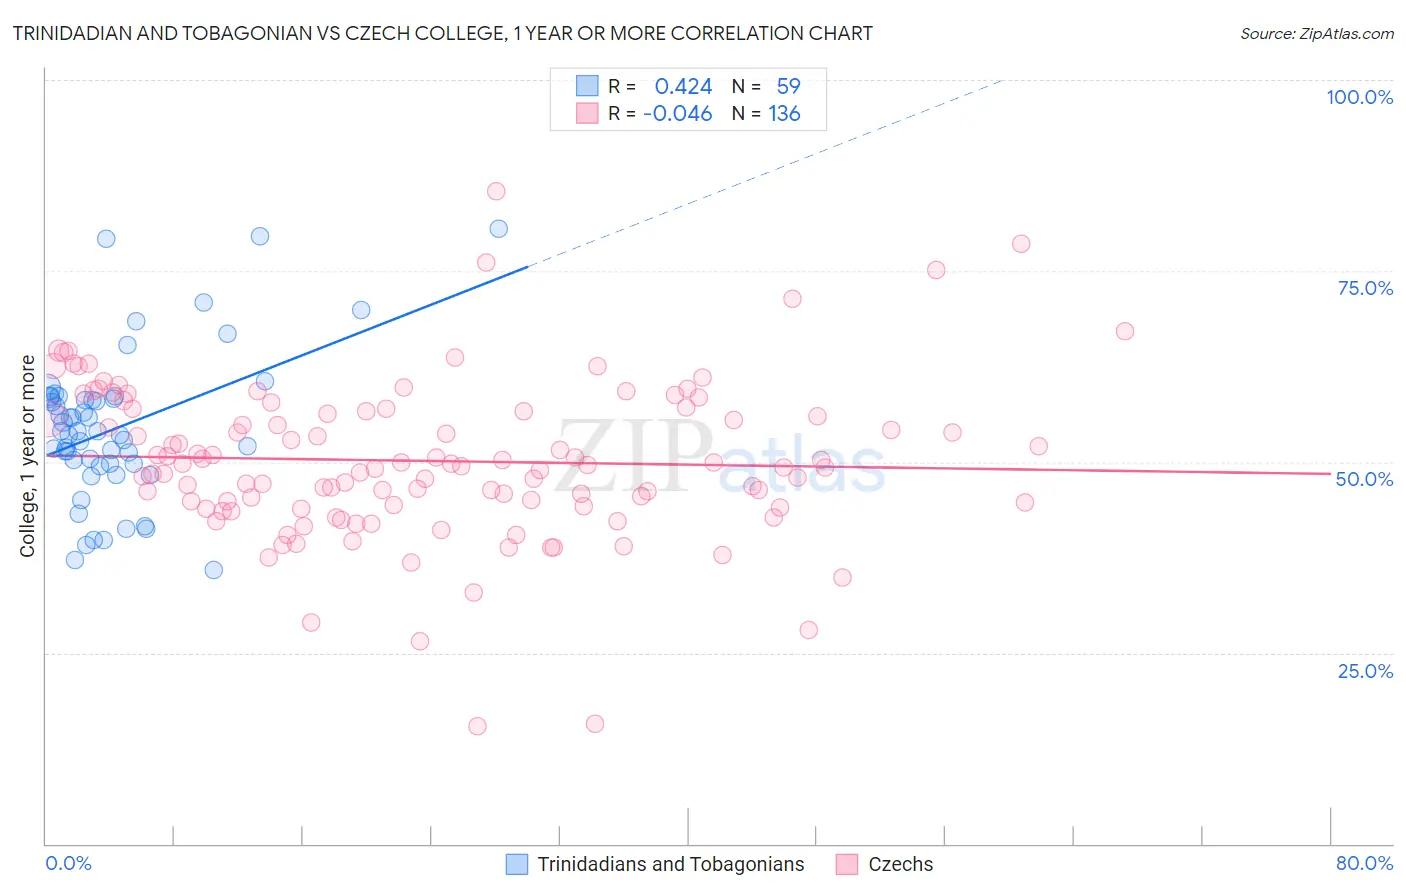
Trinidadian and Tobagonian vs Czech College, 1 year or more Correlation Chart
The statistical analysis conducted on geographies consisting of 219,882,137 people shows a moderate positive correlation between the proportion of Trinidadians and Tobagonians and percentage of population with at least college, 1 year or more education in the United States with a correlation coefficient (R) of 0.424 and weighted average of 55.8%. Similarly, the statistical analysis conducted on geographies consisting of 484,810,404 people shows no correlation between the proportion of Czechs and percentage of population with at least college, 1 year or more education in the United States with a correlation coefficient (R) of -0.046 and weighted average of 60.6%, a difference of 8.5%.
College, 1 year or more Correlation Summary
| Measurement | Trinidadian and Tobagonian | Czech |
| Minimum | 35.8% | 15.4% |
| Maximum | 80.5% | 85.4% |
| Range | 44.7% | 70.0% |
| Mean | 54.4% | 50.1% |
| Median | 54.0% | 49.5% |
| Interquartile 25% (IQ1) | 49.7% | 44.3% |
| Interquartile 75% (IQ3) | 58.4% | 56.8% |
| Interquartile Range (IQR) | 8.7% | 12.5% |
| Standard Deviation (Sample) | 9.7% | 10.5% |
| Standard Deviation (Population) | 9.6% | 10.4% |
Similar Demographics by College, 1 year or more
Demographics Similar to Trinidadians and Tobagonians by College, 1 year or more
In terms of college, 1 year or more, the demographic groups most similar to Trinidadians and Tobagonians are French American Indian (55.8%, a difference of 0.050%), Puget Sound Salish (55.9%, a difference of 0.090%), Marshallese (55.8%, a difference of 0.15%), Osage (55.8%, a difference of 0.16%), and Chippewa (55.7%, a difference of 0.28%).
| Demographics | Rating | Rank | College, 1 year or more |
| Immigrants | Nonimmigrants | 2.5 /100 | #233 | Tragic 56.5% |
| Spanish Americans | 1.8 /100 | #234 | Tragic 56.3% |
| West Indians | 1.8 /100 | #235 | Tragic 56.3% |
| Iroquois | 1.7 /100 | #236 | Tragic 56.2% |
| Samoans | 1.6 /100 | #237 | Tragic 56.2% |
| Barbadians | 1.3 /100 | #238 | Tragic 56.0% |
| Puget Sound Salish | 1.1 /100 | #239 | Tragic 55.9% |
| Trinidadians and Tobagonians | 1.1 /100 | #240 | Tragic 55.8% |
| French American Indians | 1.0 /100 | #241 | Tragic 55.8% |
| Marshallese | 1.0 /100 | #242 | Tragic 55.8% |
| Osage | 1.0 /100 | #243 | Tragic 55.8% |
| Chippewa | 0.9 /100 | #244 | Tragic 55.7% |
| Immigrants | Liberia | 0.8 /100 | #245 | Tragic 55.7% |
| Malaysians | 0.8 /100 | #246 | Tragic 55.6% |
| Hawaiians | 0.8 /100 | #247 | Tragic 55.6% |
Demographics Similar to Czechs by College, 1 year or more
In terms of college, 1 year or more, the demographic groups most similar to Czechs are Slavic (60.6%, a difference of 0.070%), Polish (60.7%, a difference of 0.080%), Canadian (60.6%, a difference of 0.080%), Immigrants from Afghanistan (60.7%, a difference of 0.11%), and Iraqi (60.7%, a difference of 0.13%).
| Demographics | Rating | Rank | College, 1 year or more |
| Slovenes | 86.5 /100 | #137 | Excellent 60.9% |
| Taiwanese | 84.3 /100 | #138 | Excellent 60.7% |
| Immigrants | Eritrea | 84.3 /100 | #139 | Excellent 60.7% |
| Iraqis | 83.3 /100 | #140 | Excellent 60.7% |
| Immigrants | Afghanistan | 83.1 /100 | #141 | Excellent 60.7% |
| Poles | 82.8 /100 | #142 | Excellent 60.7% |
| Canadians | 82.7 /100 | #143 | Excellent 60.6% |
| Czechs | 81.9 /100 | #144 | Excellent 60.6% |
| Slavs | 81.1 /100 | #145 | Excellent 60.6% |
| Scottish | 80.2 /100 | #146 | Excellent 60.5% |
| Immigrants | Kenya | 79.1 /100 | #147 | Good 60.5% |
| Kenyans | 79.0 /100 | #148 | Good 60.5% |
| Brazilians | 79.0 /100 | #149 | Good 60.5% |
| Immigrants | Sudan | 77.8 /100 | #150 | Good 60.4% |
| Albanians | 77.8 /100 | #151 | Good 60.4% |