Immigrants from Dominican Republic vs Czech College, 1 year or more
COMPARE
Immigrants from Dominican Republic
Czech
College, 1 year or more
College, 1 year or more Comparison
Immigrants from Dominican Republic
Czechs
49.1%
COLLEGE, 1 YEAR OR MORE
0.0/ 100
METRIC RATING
333rd/ 347
METRIC RANK
60.6%
COLLEGE, 1 YEAR OR MORE
81.9/ 100
METRIC RATING
144th/ 347
METRIC RANK
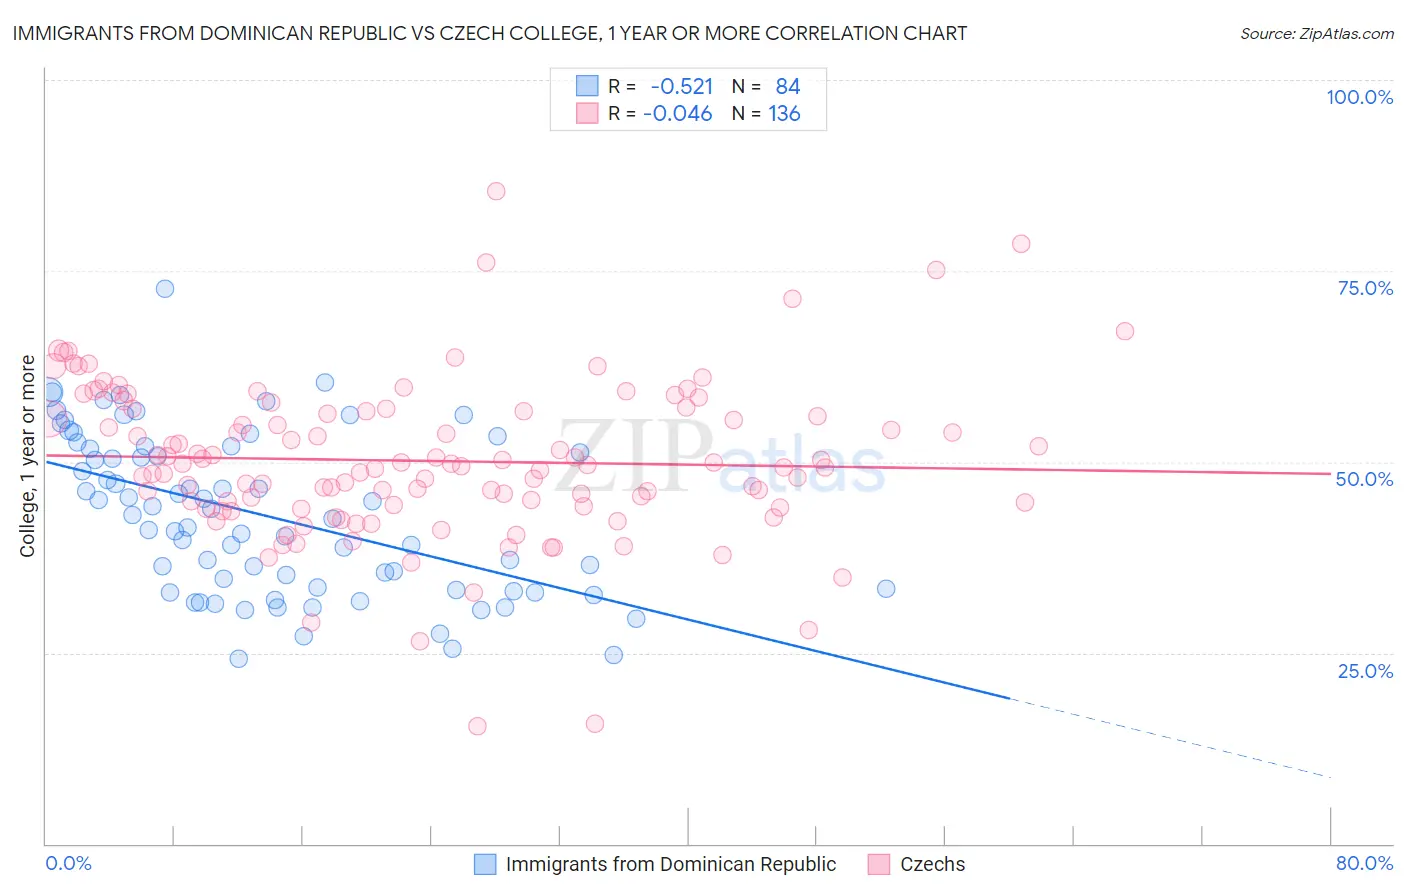
Immigrants from Dominican Republic vs Czech College, 1 year or more Correlation Chart
The statistical analysis conducted on geographies consisting of 275,143,955 people shows a substantial negative correlation between the proportion of Immigrants from Dominican Republic and percentage of population with at least college, 1 year or more education in the United States with a correlation coefficient (R) of -0.521 and weighted average of 49.1%. Similarly, the statistical analysis conducted on geographies consisting of 484,810,404 people shows no correlation between the proportion of Czechs and percentage of population with at least college, 1 year or more education in the United States with a correlation coefficient (R) of -0.046 and weighted average of 60.6%, a difference of 23.3%.
College, 1 year or more Correlation Summary
| Measurement | Immigrants from Dominican Republic | Czech |
| Minimum | 24.3% | 15.4% |
| Maximum | 72.7% | 85.4% |
| Range | 48.4% | 70.0% |
| Mean | 43.0% | 50.1% |
| Median | 42.7% | 49.5% |
| Interquartile 25% (IQ1) | 33.3% | 44.3% |
| Interquartile 75% (IQ3) | 51.9% | 56.8% |
| Interquartile Range (IQR) | 18.6% | 12.5% |
| Standard Deviation (Sample) | 10.5% | 10.5% |
| Standard Deviation (Population) | 10.4% | 10.4% |
Similar Demographics by College, 1 year or more
Demographics Similar to Immigrants from Dominican Republic by College, 1 year or more
In terms of college, 1 year or more, the demographic groups most similar to Immigrants from Dominican Republic are Mexican (49.2%, a difference of 0.17%), Lumbee (48.9%, a difference of 0.58%), Yuman (48.7%, a difference of 0.86%), Spanish American Indian (48.5%, a difference of 1.3%), and Pennsylvania German (48.5%, a difference of 1.3%).
| Demographics | Rating | Rank | College, 1 year or more |
| Dominicans | 0.0 /100 | #326 | Tragic 50.6% |
| Menominee | 0.0 /100 | #327 | Tragic 50.6% |
| Dutch West Indians | 0.0 /100 | #328 | Tragic 50.5% |
| Cape Verdeans | 0.0 /100 | #329 | Tragic 50.3% |
| Natives/Alaskans | 0.0 /100 | #330 | Tragic 50.2% |
| Immigrants | Yemen | 0.0 /100 | #331 | Tragic 50.0% |
| Mexicans | 0.0 /100 | #332 | Tragic 49.2% |
| Immigrants | Dominican Republic | 0.0 /100 | #333 | Tragic 49.1% |
| Lumbee | 0.0 /100 | #334 | Tragic 48.9% |
| Yuman | 0.0 /100 | #335 | Tragic 48.7% |
| Spanish American Indians | 0.0 /100 | #336 | Tragic 48.5% |
| Pennsylvania Germans | 0.0 /100 | #337 | Tragic 48.5% |
| Immigrants | Central America | 0.0 /100 | #338 | Tragic 48.5% |
| Immigrants | Azores | 0.0 /100 | #339 | Tragic 48.4% |
| Immigrants | Cabo Verde | 0.0 /100 | #340 | Tragic 48.1% |
Demographics Similar to Czechs by College, 1 year or more
In terms of college, 1 year or more, the demographic groups most similar to Czechs are Slavic (60.6%, a difference of 0.070%), Polish (60.7%, a difference of 0.080%), Canadian (60.6%, a difference of 0.080%), Immigrants from Afghanistan (60.7%, a difference of 0.11%), and Iraqi (60.7%, a difference of 0.13%).
| Demographics | Rating | Rank | College, 1 year or more |
| Slovenes | 86.5 /100 | #137 | Excellent 60.9% |
| Taiwanese | 84.3 /100 | #138 | Excellent 60.7% |
| Immigrants | Eritrea | 84.3 /100 | #139 | Excellent 60.7% |
| Iraqis | 83.3 /100 | #140 | Excellent 60.7% |
| Immigrants | Afghanistan | 83.1 /100 | #141 | Excellent 60.7% |
| Poles | 82.8 /100 | #142 | Excellent 60.7% |
| Canadians | 82.7 /100 | #143 | Excellent 60.6% |
| Czechs | 81.9 /100 | #144 | Excellent 60.6% |
| Slavs | 81.1 /100 | #145 | Excellent 60.6% |
| Scottish | 80.2 /100 | #146 | Excellent 60.5% |
| Immigrants | Kenya | 79.1 /100 | #147 | Good 60.5% |
| Kenyans | 79.0 /100 | #148 | Good 60.5% |
| Brazilians | 79.0 /100 | #149 | Good 60.5% |
| Immigrants | Sudan | 77.8 /100 | #150 | Good 60.4% |
| Albanians | 77.8 /100 | #151 | Good 60.4% |