Trinidadian and Tobagonian vs Mexican American Indian College, 1 year or more
COMPARE
Trinidadian and Tobagonian
Mexican American Indian
College, 1 year or more
College, 1 year or more Comparison
Trinidadians and Tobagonians
Mexican American Indians
55.8%
COLLEGE, 1 YEAR OR MORE
1.1/ 100
METRIC RATING
240th/ 347
METRIC RANK
51.9%
COLLEGE, 1 YEAR OR MORE
0.0/ 100
METRIC RATING
306th/ 347
METRIC RANK
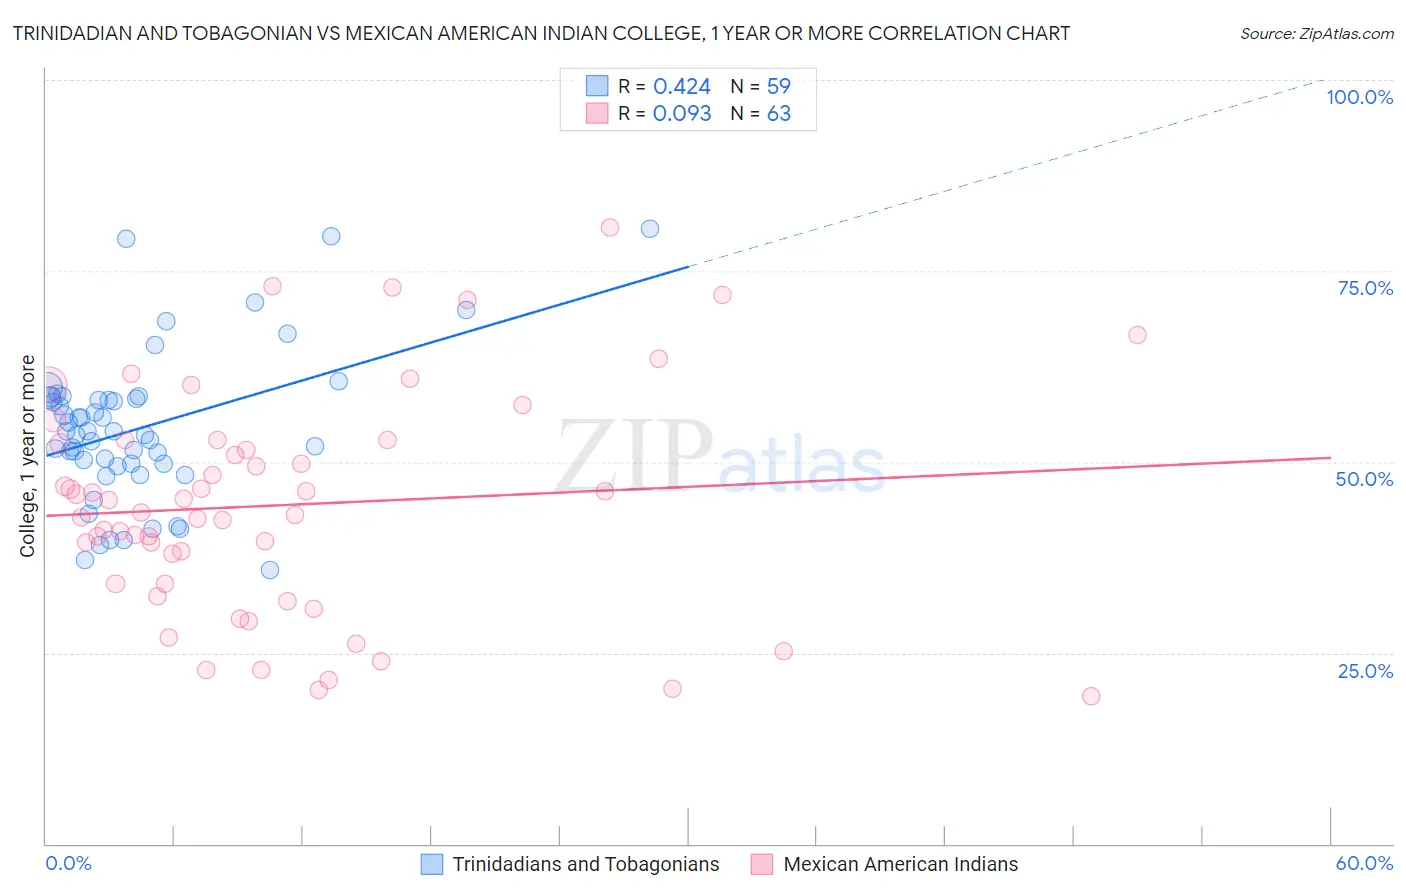
Trinidadian and Tobagonian vs Mexican American Indian College, 1 year or more Correlation Chart
The statistical analysis conducted on geographies consisting of 219,882,137 people shows a moderate positive correlation between the proportion of Trinidadians and Tobagonians and percentage of population with at least college, 1 year or more education in the United States with a correlation coefficient (R) of 0.424 and weighted average of 55.8%. Similarly, the statistical analysis conducted on geographies consisting of 317,621,155 people shows a slight positive correlation between the proportion of Mexican American Indians and percentage of population with at least college, 1 year or more education in the United States with a correlation coefficient (R) of 0.093 and weighted average of 51.9%, a difference of 7.6%.
College, 1 year or more Correlation Summary
| Measurement | Trinidadian and Tobagonian | Mexican American Indian |
| Minimum | 35.8% | 19.3% |
| Maximum | 80.5% | 80.8% |
| Range | 44.7% | 61.4% |
| Mean | 54.4% | 44.3% |
| Median | 54.0% | 43.4% |
| Interquartile 25% (IQ1) | 49.7% | 34.0% |
| Interquartile 75% (IQ3) | 58.4% | 52.8% |
| Interquartile Range (IQR) | 8.7% | 18.8% |
| Standard Deviation (Sample) | 9.7% | 14.6% |
| Standard Deviation (Population) | 9.6% | 14.5% |
Similar Demographics by College, 1 year or more
Demographics Similar to Trinidadians and Tobagonians by College, 1 year or more
In terms of college, 1 year or more, the demographic groups most similar to Trinidadians and Tobagonians are French American Indian (55.8%, a difference of 0.050%), Puget Sound Salish (55.9%, a difference of 0.090%), Marshallese (55.8%, a difference of 0.15%), Osage (55.8%, a difference of 0.16%), and Chippewa (55.7%, a difference of 0.28%).
| Demographics | Rating | Rank | College, 1 year or more |
| Immigrants | Nonimmigrants | 2.5 /100 | #233 | Tragic 56.5% |
| Spanish Americans | 1.8 /100 | #234 | Tragic 56.3% |
| West Indians | 1.8 /100 | #235 | Tragic 56.3% |
| Iroquois | 1.7 /100 | #236 | Tragic 56.2% |
| Samoans | 1.6 /100 | #237 | Tragic 56.2% |
| Barbadians | 1.3 /100 | #238 | Tragic 56.0% |
| Puget Sound Salish | 1.1 /100 | #239 | Tragic 55.9% |
| Trinidadians and Tobagonians | 1.1 /100 | #240 | Tragic 55.8% |
| French American Indians | 1.0 /100 | #241 | Tragic 55.8% |
| Marshallese | 1.0 /100 | #242 | Tragic 55.8% |
| Osage | 1.0 /100 | #243 | Tragic 55.8% |
| Chippewa | 0.9 /100 | #244 | Tragic 55.7% |
| Immigrants | Liberia | 0.8 /100 | #245 | Tragic 55.7% |
| Malaysians | 0.8 /100 | #246 | Tragic 55.6% |
| Hawaiians | 0.8 /100 | #247 | Tragic 55.6% |
Demographics Similar to Mexican American Indians by College, 1 year or more
In terms of college, 1 year or more, the demographic groups most similar to Mexican American Indians are Immigrants from Portugal (51.9%, a difference of 0.10%), Salvadoran (51.8%, a difference of 0.20%), Apache (51.8%, a difference of 0.22%), Seminole (52.1%, a difference of 0.33%), and Central American (52.1%, a difference of 0.43%).
| Demographics | Rating | Rank | College, 1 year or more |
| Immigrants | Nicaragua | 0.0 /100 | #299 | Tragic 52.4% |
| Choctaw | 0.0 /100 | #300 | Tragic 52.3% |
| Haitians | 0.0 /100 | #301 | Tragic 52.3% |
| Puerto Ricans | 0.0 /100 | #302 | Tragic 52.2% |
| Creek | 0.0 /100 | #303 | Tragic 52.2% |
| Central Americans | 0.0 /100 | #304 | Tragic 52.1% |
| Seminole | 0.0 /100 | #305 | Tragic 52.1% |
| Mexican American Indians | 0.0 /100 | #306 | Tragic 51.9% |
| Immigrants | Portugal | 0.0 /100 | #307 | Tragic 51.9% |
| Salvadorans | 0.0 /100 | #308 | Tragic 51.8% |
| Apache | 0.0 /100 | #309 | Tragic 51.8% |
| Hondurans | 0.0 /100 | #310 | Tragic 51.6% |
| Immigrants | Haiti | 0.0 /100 | #311 | Tragic 51.5% |
| Pueblo | 0.0 /100 | #312 | Tragic 51.5% |
| Immigrants | Caribbean | 0.0 /100 | #313 | Tragic 51.4% |