Trinidadian and Tobagonian vs Japanese College, 1 year or more
COMPARE
Trinidadian and Tobagonian
Japanese
College, 1 year or more
College, 1 year or more Comparison
Trinidadians and Tobagonians
Japanese
55.8%
COLLEGE, 1 YEAR OR MORE
1.1/ 100
METRIC RATING
240th/ 347
METRIC RANK
55.2%
COLLEGE, 1 YEAR OR MORE
0.5/ 100
METRIC RATING
254th/ 347
METRIC RANK
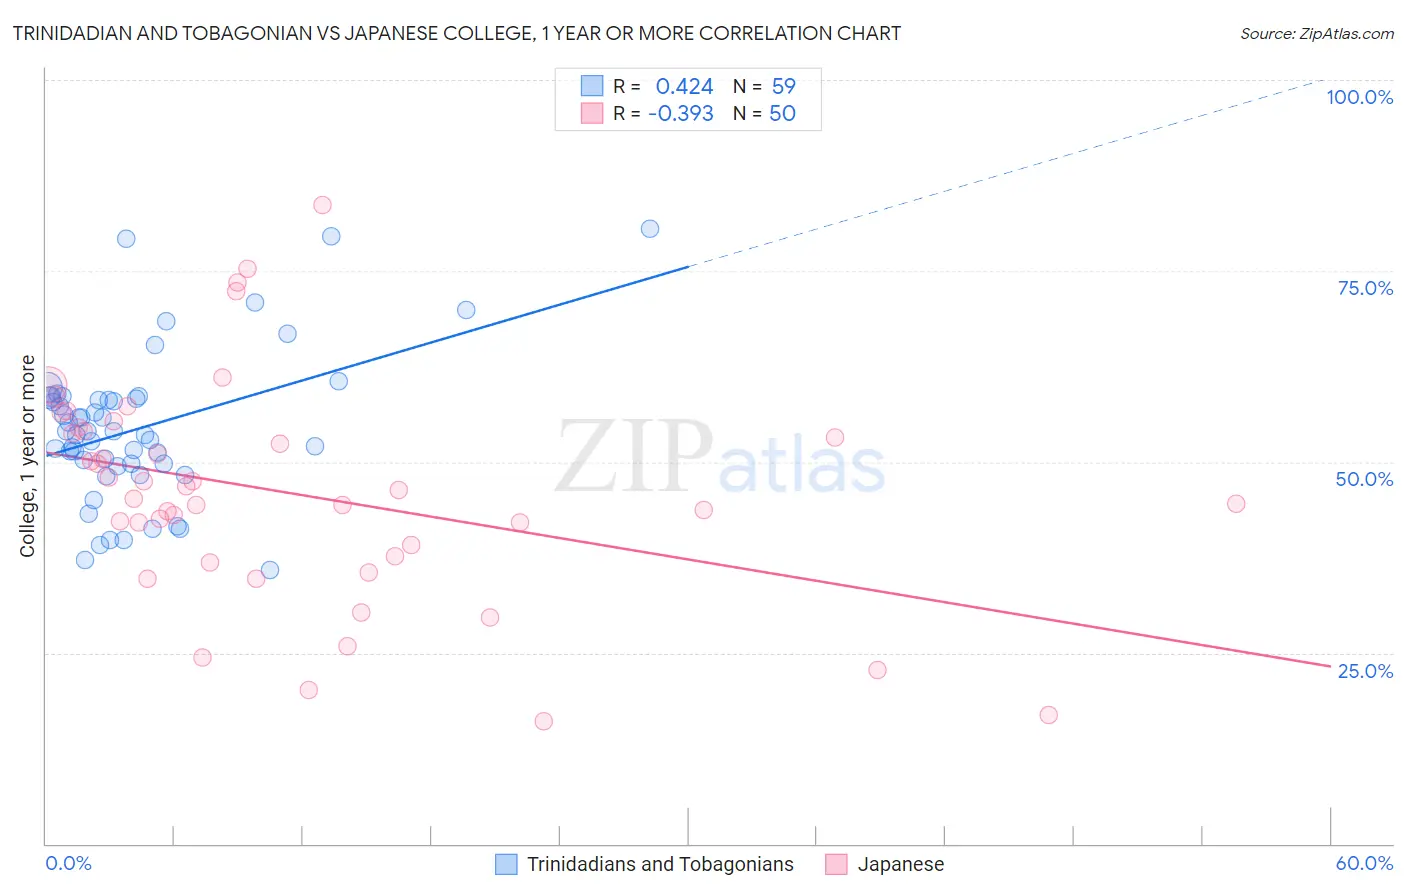
Trinidadian and Tobagonian vs Japanese College, 1 year or more Correlation Chart
The statistical analysis conducted on geographies consisting of 219,882,137 people shows a moderate positive correlation between the proportion of Trinidadians and Tobagonians and percentage of population with at least college, 1 year or more education in the United States with a correlation coefficient (R) of 0.424 and weighted average of 55.8%. Similarly, the statistical analysis conducted on geographies consisting of 249,181,552 people shows a mild negative correlation between the proportion of Japanese and percentage of population with at least college, 1 year or more education in the United States with a correlation coefficient (R) of -0.393 and weighted average of 55.2%, a difference of 1.1%.
College, 1 year or more Correlation Summary
| Measurement | Trinidadian and Tobagonian | Japanese |
| Minimum | 35.8% | 16.1% |
| Maximum | 80.5% | 83.7% |
| Range | 44.7% | 67.6% |
| Mean | 54.4% | 45.9% |
| Median | 54.0% | 45.8% |
| Interquartile 25% (IQ1) | 49.7% | 37.6% |
| Interquartile 75% (IQ3) | 58.4% | 54.1% |
| Interquartile Range (IQR) | 8.7% | 16.5% |
| Standard Deviation (Sample) | 9.7% | 14.4% |
| Standard Deviation (Population) | 9.6% | 14.2% |
Demographics Similar to Trinidadians and Tobagonians and Japanese by College, 1 year or more
In terms of college, 1 year or more, the demographic groups most similar to Trinidadians and Tobagonians are French American Indian (55.8%, a difference of 0.050%), Puget Sound Salish (55.9%, a difference of 0.090%), Marshallese (55.8%, a difference of 0.15%), Osage (55.8%, a difference of 0.16%), and Chippewa (55.7%, a difference of 0.28%). Similarly, the demographic groups most similar to Japanese are Immigrants from Bahamas (55.2%, a difference of 0.050%), Immigrants from West Indies (55.2%, a difference of 0.12%), Indonesian (55.1%, a difference of 0.22%), Immigrants from Barbados (55.4%, a difference of 0.25%), and Aleut (55.4%, a difference of 0.36%).
| Demographics | Rating | Rank | College, 1 year or more |
| Samoans | 1.6 /100 | #237 | Tragic 56.2% |
| Barbadians | 1.3 /100 | #238 | Tragic 56.0% |
| Puget Sound Salish | 1.1 /100 | #239 | Tragic 55.9% |
| Trinidadians and Tobagonians | 1.1 /100 | #240 | Tragic 55.8% |
| French American Indians | 1.0 /100 | #241 | Tragic 55.8% |
| Marshallese | 1.0 /100 | #242 | Tragic 55.8% |
| Osage | 1.0 /100 | #243 | Tragic 55.8% |
| Chippewa | 0.9 /100 | #244 | Tragic 55.7% |
| Immigrants | Liberia | 0.8 /100 | #245 | Tragic 55.7% |
| Malaysians | 0.8 /100 | #246 | Tragic 55.6% |
| Hawaiians | 0.8 /100 | #247 | Tragic 55.6% |
| Immigrants | Congo | 0.8 /100 | #248 | Tragic 55.6% |
| Immigrants | Trinidad and Tobago | 0.7 /100 | #249 | Tragic 55.5% |
| Delaware | 0.7 /100 | #250 | Tragic 55.5% |
| Immigrants | Cambodia | 0.6 /100 | #251 | Tragic 55.4% |
| Aleuts | 0.6 /100 | #252 | Tragic 55.4% |
| Immigrants | Barbados | 0.6 /100 | #253 | Tragic 55.4% |
| Japanese | 0.5 /100 | #254 | Tragic 55.2% |
| Immigrants | Bahamas | 0.5 /100 | #255 | Tragic 55.2% |
| Immigrants | West Indies | 0.5 /100 | #256 | Tragic 55.2% |
| Indonesians | 0.4 /100 | #257 | Tragic 55.1% |