Immigrants from North America vs Czech College, 1 year or more
COMPARE
Immigrants from North America
Czech
College, 1 year or more
College, 1 year or more Comparison
Immigrants from North America
Czechs
63.0%
COLLEGE, 1 YEAR OR MORE
99.0/ 100
METRIC RATING
74th/ 347
METRIC RANK
60.6%
COLLEGE, 1 YEAR OR MORE
81.9/ 100
METRIC RATING
144th/ 347
METRIC RANK
Immigrants from North America vs Czech College, 1 year or more Correlation Chart
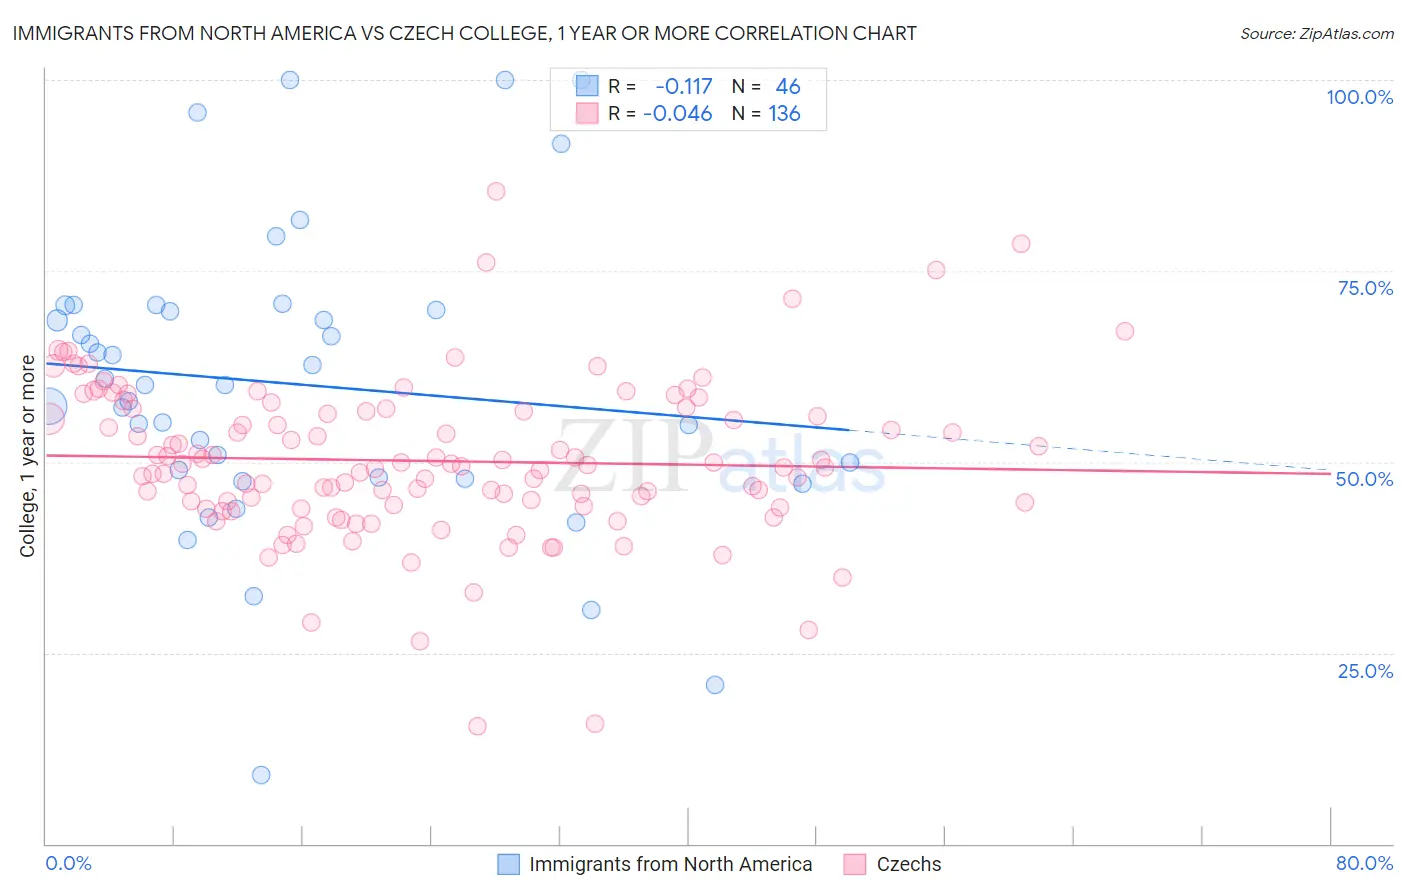
The statistical analysis conducted on geographies consisting of 462,456,246 people shows a poor negative correlation between the proportion of Immigrants from North America and percentage of population with at least college, 1 year or more education in the United States with a correlation coefficient (R) of -0.117 and weighted average of 63.0%. Similarly, the statistical analysis conducted on geographies consisting of 484,810,404 people shows no correlation between the proportion of Czechs and percentage of population with at least college, 1 year or more education in the United States with a correlation coefficient (R) of -0.046 and weighted average of 60.6%, a difference of 4.0%.
College, 1 year or more Correlation Summary
| Measurement | Immigrants from North America | Czech |
| Minimum | 9.0% | 15.4% |
| Maximum | 100.0% | 85.4% |
| Range | 91.0% | 70.0% |
| Mean | 60.2% | 50.1% |
| Median | 60.0% | 49.5% |
| Interquartile 25% (IQ1) | 47.9% | 44.3% |
| Interquartile 75% (IQ3) | 69.9% | 56.8% |
| Interquartile Range (IQR) | 22.0% | 12.5% |
| Standard Deviation (Sample) | 19.4% | 10.5% |
| Standard Deviation (Population) | 19.2% | 10.4% |
Similar Demographics by College, 1 year or more
Demographics Similar to Immigrants from North America by College, 1 year or more
In terms of college, 1 year or more, the demographic groups most similar to Immigrants from North America are Immigrants from Moldova (63.0%, a difference of 0.020%), Egyptian (63.1%, a difference of 0.030%), Immigrants from Canada (63.1%, a difference of 0.080%), Armenian (63.0%, a difference of 0.090%), and Paraguayan (62.9%, a difference of 0.19%).
| Demographics | Rating | Rank | College, 1 year or more |
| Immigrants | Romania | 99.3 /100 | #67 | Exceptional 63.3% |
| Immigrants | Greece | 99.3 /100 | #68 | Exceptional 63.3% |
| Immigrants | Zimbabwe | 99.3 /100 | #69 | Exceptional 63.3% |
| Argentineans | 99.2 /100 | #70 | Exceptional 63.2% |
| Immigrants | Canada | 99.1 /100 | #71 | Exceptional 63.1% |
| Egyptians | 99.0 /100 | #72 | Exceptional 63.1% |
| Immigrants | Moldova | 99.0 /100 | #73 | Exceptional 63.0% |
| Immigrants | North America | 99.0 /100 | #74 | Exceptional 63.0% |
| Armenians | 98.9 /100 | #75 | Exceptional 63.0% |
| Paraguayans | 98.8 /100 | #76 | Exceptional 62.9% |
| Ethiopians | 98.8 /100 | #77 | Exceptional 62.9% |
| Immigrants | Lebanon | 98.8 /100 | #78 | Exceptional 62.9% |
| Northern Europeans | 98.8 /100 | #79 | Exceptional 62.9% |
| Lithuanians | 98.8 /100 | #80 | Exceptional 62.9% |
| Laotians | 98.7 /100 | #81 | Exceptional 62.8% |
Demographics Similar to Czechs by College, 1 year or more
In terms of college, 1 year or more, the demographic groups most similar to Czechs are Slavic (60.6%, a difference of 0.070%), Polish (60.7%, a difference of 0.080%), Canadian (60.6%, a difference of 0.080%), Immigrants from Afghanistan (60.7%, a difference of 0.11%), and Iraqi (60.7%, a difference of 0.13%).
| Demographics | Rating | Rank | College, 1 year or more |
| Slovenes | 86.5 /100 | #137 | Excellent 60.9% |
| Taiwanese | 84.3 /100 | #138 | Excellent 60.7% |
| Immigrants | Eritrea | 84.3 /100 | #139 | Excellent 60.7% |
| Iraqis | 83.3 /100 | #140 | Excellent 60.7% |
| Immigrants | Afghanistan | 83.1 /100 | #141 | Excellent 60.7% |
| Poles | 82.8 /100 | #142 | Excellent 60.7% |
| Canadians | 82.7 /100 | #143 | Excellent 60.6% |
| Czechs | 81.9 /100 | #144 | Excellent 60.6% |
| Slavs | 81.1 /100 | #145 | Excellent 60.6% |
| Scottish | 80.2 /100 | #146 | Excellent 60.5% |
| Immigrants | Kenya | 79.1 /100 | #147 | Good 60.5% |
| Kenyans | 79.0 /100 | #148 | Good 60.5% |
| Brazilians | 79.0 /100 | #149 | Good 60.5% |
| Immigrants | Sudan | 77.8 /100 | #150 | Good 60.4% |
| Albanians | 77.8 /100 | #151 | Good 60.4% |