Trinidadian and Tobagonian vs Czech Vision Disability
COMPARE
Trinidadian and Tobagonian
Czech
Vision Disability
Vision Disability Comparison
Trinidadians and Tobagonians
Czechs
2.2%
VISION DISABILITY
8.2/ 100
METRIC RATING
214th/ 347
METRIC RANK
2.1%
VISION DISABILITY
86.3/ 100
METRIC RATING
136th/ 347
METRIC RANK
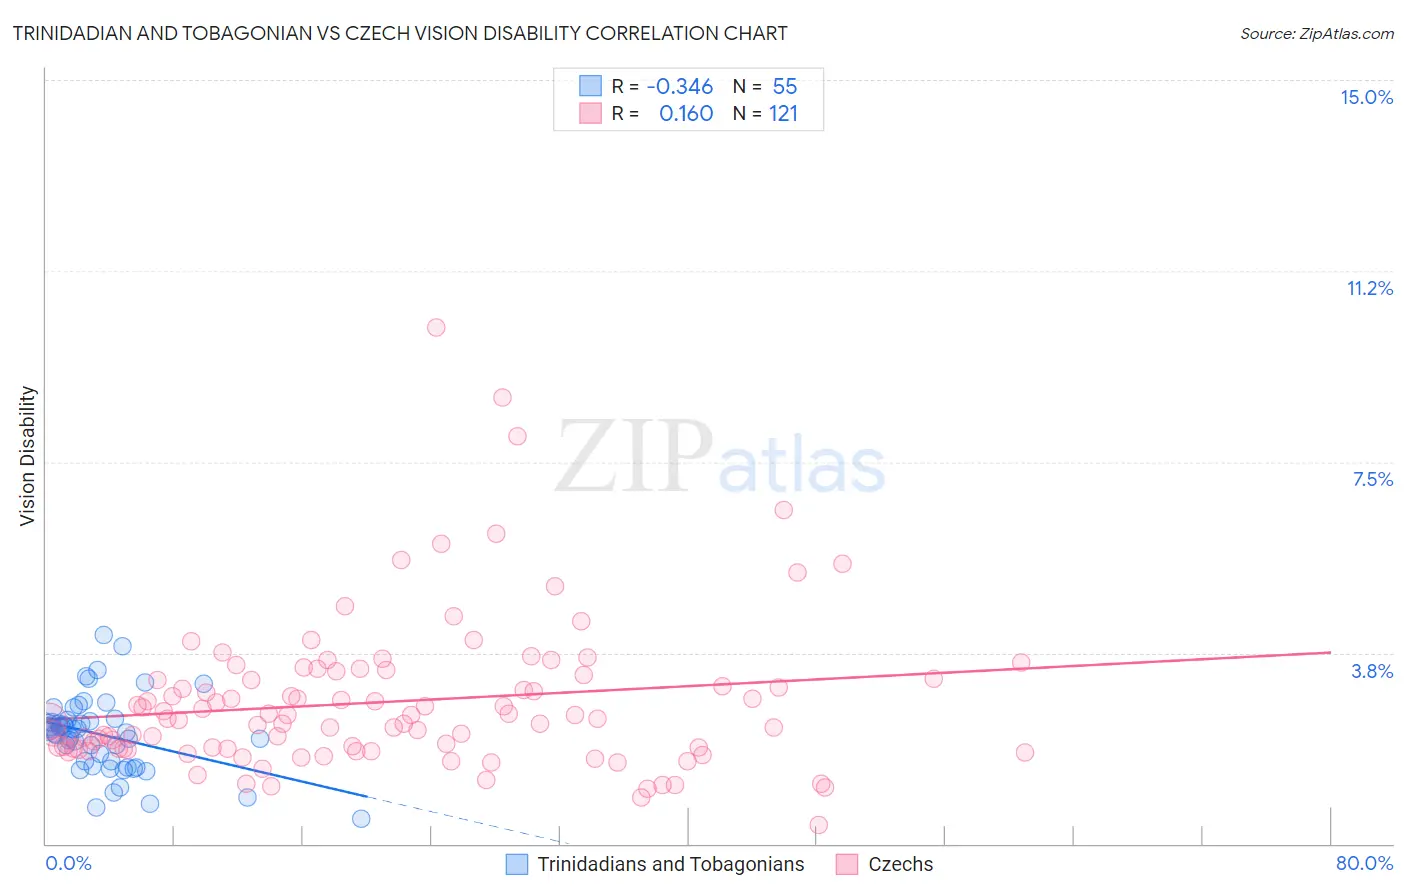
Trinidadian and Tobagonian vs Czech Vision Disability Correlation Chart
The statistical analysis conducted on geographies consisting of 219,745,653 people shows a mild negative correlation between the proportion of Trinidadians and Tobagonians and percentage of population with vision disability in the United States with a correlation coefficient (R) of -0.346 and weighted average of 2.2%. Similarly, the statistical analysis conducted on geographies consisting of 483,953,128 people shows a poor positive correlation between the proportion of Czechs and percentage of population with vision disability in the United States with a correlation coefficient (R) of 0.160 and weighted average of 2.1%, a difference of 6.9%.
Vision Disability Correlation Summary
| Measurement | Trinidadian and Tobagonian | Czech |
| Minimum | 0.49% | 0.36% |
| Maximum | 4.1% | 10.1% |
| Range | 3.6% | 9.8% |
| Mean | 2.1% | 2.8% |
| Median | 2.2% | 2.4% |
| Interquartile 25% (IQ1) | 1.5% | 1.9% |
| Interquartile 75% (IQ3) | 2.4% | 3.3% |
| Interquartile Range (IQR) | 0.92% | 1.4% |
| Standard Deviation (Sample) | 0.75% | 1.5% |
| Standard Deviation (Population) | 0.74% | 1.5% |
Similar Demographics by Vision Disability
Demographics Similar to Trinidadians and Tobagonians by Vision Disability
In terms of vision disability, the demographic groups most similar to Trinidadians and Tobagonians are Immigrants from Ghana (2.2%, a difference of 0.13%), Bermudan (2.2%, a difference of 0.14%), Nigerian (2.3%, a difference of 0.21%), Indonesian (2.2%, a difference of 0.23%), and Immigrants from Trinidad and Tobago (2.3%, a difference of 0.50%).
| Demographics | Rating | Rank | Vision Disability |
| Immigrants | Nigeria | 13.5 /100 | #207 | Poor 2.2% |
| Germans | 13.4 /100 | #208 | Poor 2.2% |
| Immigrants | Brazil | 13.1 /100 | #209 | Poor 2.2% |
| Immigrants | Uruguay | 11.5 /100 | #210 | Poor 2.2% |
| Indonesians | 9.5 /100 | #211 | Tragic 2.2% |
| Bermudans | 9.0 /100 | #212 | Tragic 2.2% |
| Immigrants | Ghana | 8.9 /100 | #213 | Tragic 2.2% |
| Trinidadians and Tobagonians | 8.2 /100 | #214 | Tragic 2.2% |
| Nigerians | 7.2 /100 | #215 | Tragic 2.3% |
| Immigrants | Trinidad and Tobago | 6.1 /100 | #216 | Tragic 2.3% |
| Barbadians | 5.1 /100 | #217 | Tragic 2.3% |
| Portuguese | 4.9 /100 | #218 | Tragic 2.3% |
| Ecuadorians | 4.6 /100 | #219 | Tragic 2.3% |
| Guamanians/Chamorros | 3.9 /100 | #220 | Tragic 2.3% |
| French Canadians | 3.9 /100 | #221 | Tragic 2.3% |
Demographics Similar to Czechs by Vision Disability
In terms of vision disability, the demographic groups most similar to Czechs are Immigrants from South Eastern Asia (2.1%, a difference of 0.0%), Arab (2.1%, a difference of 0.010%), Vietnamese (2.1%, a difference of 0.050%), Venezuelan (2.1%, a difference of 0.12%), and Immigrants from Morocco (2.1%, a difference of 0.15%).
| Demographics | Rating | Rank | Vision Disability |
| Immigrants | Cameroon | 88.8 /100 | #129 | Excellent 2.1% |
| Immigrants | Kenya | 88.7 /100 | #130 | Excellent 2.1% |
| Immigrants | Hungary | 88.7 /100 | #131 | Excellent 2.1% |
| New Zealanders | 88.2 /100 | #132 | Excellent 2.1% |
| Syrians | 87.5 /100 | #133 | Excellent 2.1% |
| Venezuelans | 87.2 /100 | #134 | Excellent 2.1% |
| Vietnamese | 86.7 /100 | #135 | Excellent 2.1% |
| Czechs | 86.3 /100 | #136 | Excellent 2.1% |
| Immigrants | South Eastern Asia | 86.3 /100 | #137 | Excellent 2.1% |
| Arabs | 86.3 /100 | #138 | Excellent 2.1% |
| Immigrants | Morocco | 85.2 /100 | #139 | Excellent 2.1% |
| Immigrants | Netherlands | 84.2 /100 | #140 | Excellent 2.1% |
| Sierra Leoneans | 84.1 /100 | #141 | Excellent 2.1% |
| South Americans | 82.8 /100 | #142 | Excellent 2.1% |
| Immigrants | Sierra Leone | 82.8 /100 | #143 | Excellent 2.1% |