Trinidadian and Tobagonian vs Immigrants from Serbia College, 1 year or more
COMPARE
Trinidadian and Tobagonian
Immigrants from Serbia
College, 1 year or more
College, 1 year or more Comparison
Trinidadians and Tobagonians
Immigrants from Serbia
55.8%
COLLEGE, 1 YEAR OR MORE
1.1/ 100
METRIC RATING
240th/ 347
METRIC RANK
63.8%
COLLEGE, 1 YEAR OR MORE
99.6/ 100
METRIC RATING
59th/ 347
METRIC RANK
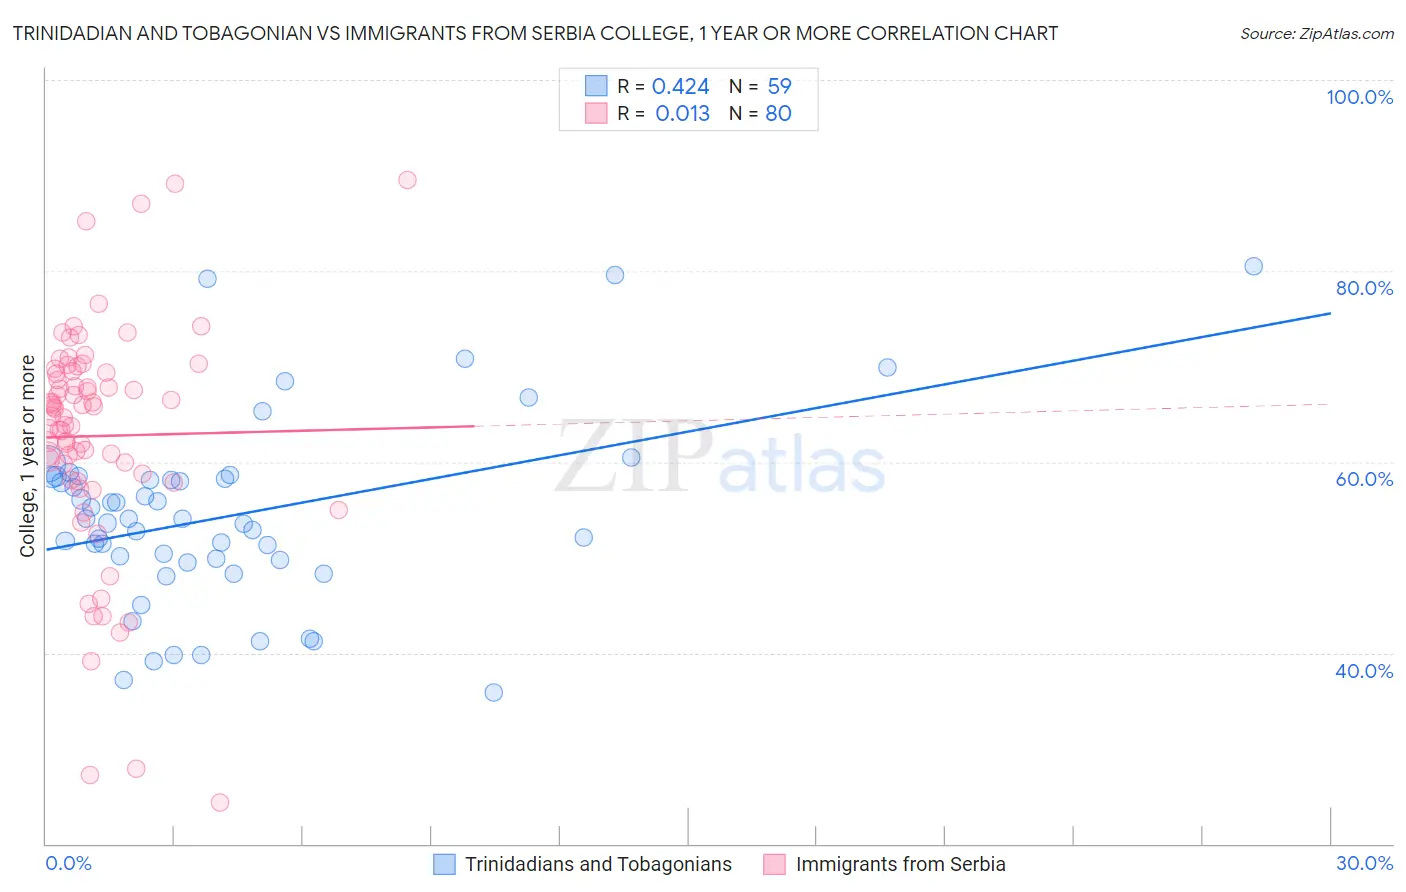
Trinidadian and Tobagonian vs Immigrants from Serbia College, 1 year or more Correlation Chart
The statistical analysis conducted on geographies consisting of 219,882,137 people shows a moderate positive correlation between the proportion of Trinidadians and Tobagonians and percentage of population with at least college, 1 year or more education in the United States with a correlation coefficient (R) of 0.424 and weighted average of 55.8%. Similarly, the statistical analysis conducted on geographies consisting of 131,742,963 people shows no correlation between the proportion of Immigrants from Serbia and percentage of population with at least college, 1 year or more education in the United States with a correlation coefficient (R) of 0.013 and weighted average of 63.8%, a difference of 14.2%.
College, 1 year or more Correlation Summary
| Measurement | Trinidadian and Tobagonian | Immigrants from Serbia |
| Minimum | 35.8% | 24.3% |
| Maximum | 80.5% | 89.5% |
| Range | 44.7% | 65.1% |
| Mean | 54.4% | 62.7% |
| Median | 54.0% | 65.2% |
| Interquartile 25% (IQ1) | 49.7% | 58.5% |
| Interquartile 75% (IQ3) | 58.4% | 69.4% |
| Interquartile Range (IQR) | 8.7% | 11.0% |
| Standard Deviation (Sample) | 9.7% | 12.2% |
| Standard Deviation (Population) | 9.6% | 12.1% |
Similar Demographics by College, 1 year or more
Demographics Similar to Trinidadians and Tobagonians by College, 1 year or more
In terms of college, 1 year or more, the demographic groups most similar to Trinidadians and Tobagonians are French American Indian (55.8%, a difference of 0.050%), Puget Sound Salish (55.9%, a difference of 0.090%), Marshallese (55.8%, a difference of 0.15%), Osage (55.8%, a difference of 0.16%), and Chippewa (55.7%, a difference of 0.28%).
| Demographics | Rating | Rank | College, 1 year or more |
| Immigrants | Nonimmigrants | 2.5 /100 | #233 | Tragic 56.5% |
| Spanish Americans | 1.8 /100 | #234 | Tragic 56.3% |
| West Indians | 1.8 /100 | #235 | Tragic 56.3% |
| Iroquois | 1.7 /100 | #236 | Tragic 56.2% |
| Samoans | 1.6 /100 | #237 | Tragic 56.2% |
| Barbadians | 1.3 /100 | #238 | Tragic 56.0% |
| Puget Sound Salish | 1.1 /100 | #239 | Tragic 55.9% |
| Trinidadians and Tobagonians | 1.1 /100 | #240 | Tragic 55.8% |
| French American Indians | 1.0 /100 | #241 | Tragic 55.8% |
| Marshallese | 1.0 /100 | #242 | Tragic 55.8% |
| Osage | 1.0 /100 | #243 | Tragic 55.8% |
| Chippewa | 0.9 /100 | #244 | Tragic 55.7% |
| Immigrants | Liberia | 0.8 /100 | #245 | Tragic 55.7% |
| Malaysians | 0.8 /100 | #246 | Tragic 55.6% |
| Hawaiians | 0.8 /100 | #247 | Tragic 55.6% |
Demographics Similar to Immigrants from Serbia by College, 1 year or more
In terms of college, 1 year or more, the demographic groups most similar to Immigrants from Serbia are Immigrants from Kazakhstan (63.6%, a difference of 0.27%), Immigrants from Asia (64.0%, a difference of 0.35%), Bolivian (63.5%, a difference of 0.38%), Immigrants from Indonesia (63.5%, a difference of 0.39%), and South African (64.1%, a difference of 0.49%).
| Demographics | Rating | Rank | College, 1 year or more |
| Immigrants | Netherlands | 99.8 /100 | #52 | Exceptional 64.2% |
| Asians | 99.8 /100 | #53 | Exceptional 64.2% |
| Zimbabweans | 99.8 /100 | #54 | Exceptional 64.2% |
| Immigrants | Belarus | 99.7 /100 | #55 | Exceptional 64.1% |
| Immigrants | Czechoslovakia | 99.7 /100 | #56 | Exceptional 64.1% |
| South Africans | 99.7 /100 | #57 | Exceptional 64.1% |
| Immigrants | Asia | 99.7 /100 | #58 | Exceptional 64.0% |
| Immigrants | Serbia | 99.6 /100 | #59 | Exceptional 63.8% |
| Immigrants | Kazakhstan | 99.5 /100 | #60 | Exceptional 63.6% |
| Bolivians | 99.5 /100 | #61 | Exceptional 63.5% |
| Immigrants | Indonesia | 99.5 /100 | #62 | Exceptional 63.5% |
| Immigrants | Scotland | 99.4 /100 | #63 | Exceptional 63.4% |
| Immigrants | Spain | 99.4 /100 | #64 | Exceptional 63.4% |
| Maltese | 99.3 /100 | #65 | Exceptional 63.4% |
| Immigrants | Europe | 99.3 /100 | #66 | Exceptional 63.3% |