Immigrants from Senegal vs Czech College, 1 year or more
COMPARE
Immigrants from Senegal
Czech
College, 1 year or more
College, 1 year or more Comparison
Immigrants from Senegal
Czechs
57.8%
COLLEGE, 1 YEAR OR MORE
11.8/ 100
METRIC RATING
212th/ 347
METRIC RANK
60.6%
COLLEGE, 1 YEAR OR MORE
81.9/ 100
METRIC RATING
144th/ 347
METRIC RANK
Immigrants from Senegal vs Czech College, 1 year or more Correlation Chart
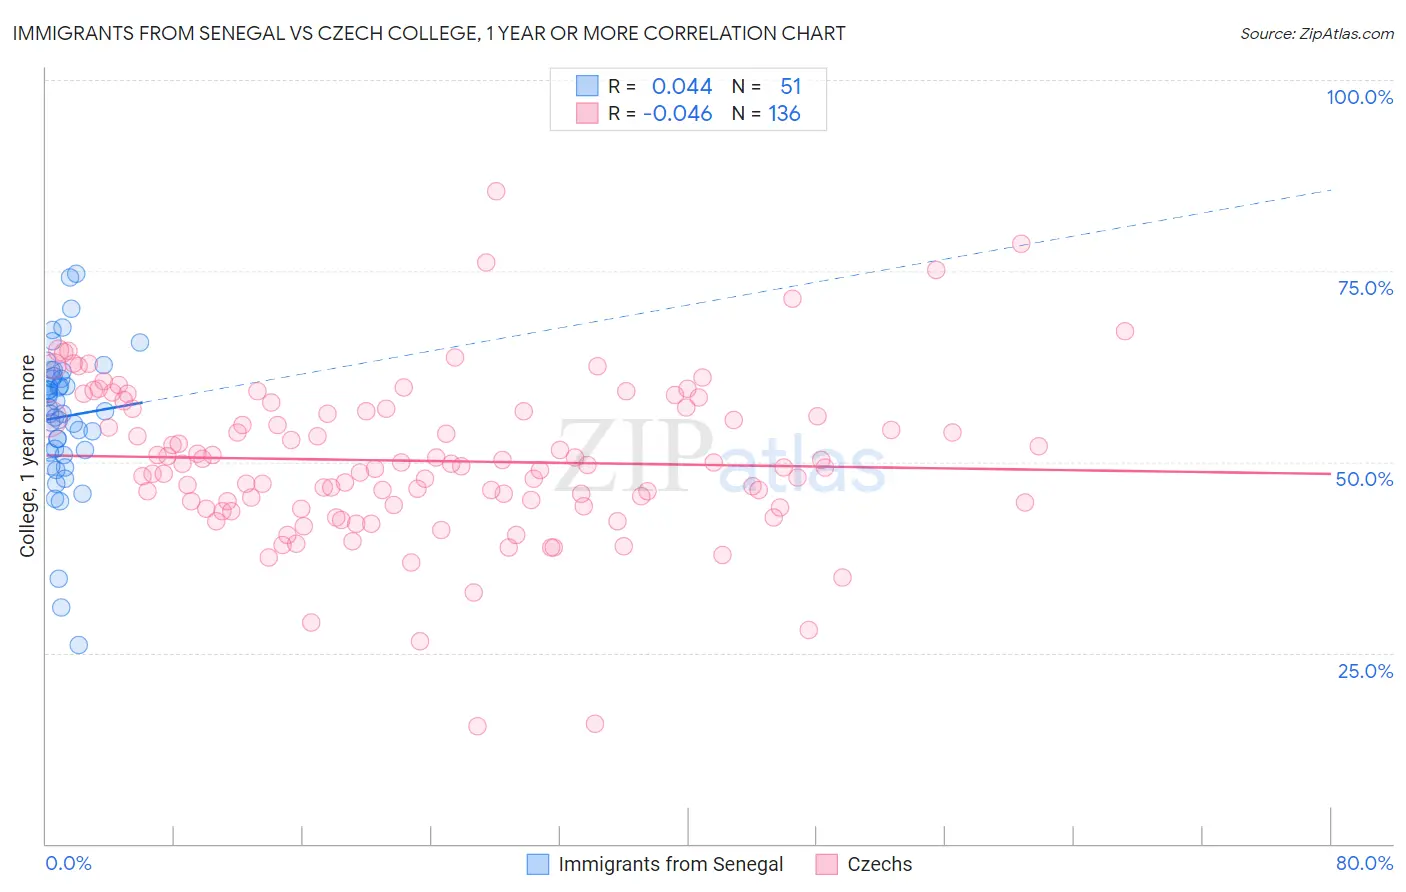
The statistical analysis conducted on geographies consisting of 90,129,295 people shows no correlation between the proportion of Immigrants from Senegal and percentage of population with at least college, 1 year or more education in the United States with a correlation coefficient (R) of 0.044 and weighted average of 57.8%. Similarly, the statistical analysis conducted on geographies consisting of 484,810,404 people shows no correlation between the proportion of Czechs and percentage of population with at least college, 1 year or more education in the United States with a correlation coefficient (R) of -0.046 and weighted average of 60.6%, a difference of 4.8%.
College, 1 year or more Correlation Summary
| Measurement | Immigrants from Senegal | Czech |
| Minimum | 26.1% | 15.4% |
| Maximum | 74.6% | 85.4% |
| Range | 48.5% | 70.0% |
| Mean | 55.9% | 50.1% |
| Median | 56.6% | 49.5% |
| Interquartile 25% (IQ1) | 51.3% | 44.3% |
| Interquartile 75% (IQ3) | 61.1% | 56.8% |
| Interquartile Range (IQR) | 9.8% | 12.5% |
| Standard Deviation (Sample) | 9.4% | 10.5% |
| Standard Deviation (Population) | 9.3% | 10.4% |
Similar Demographics by College, 1 year or more
Demographics Similar to Immigrants from Senegal by College, 1 year or more
In terms of college, 1 year or more, the demographic groups most similar to Immigrants from Senegal are French Canadian (57.8%, a difference of 0.0%), Immigrants from Colombia (57.8%, a difference of 0.030%), Tongan (57.8%, a difference of 0.040%), Immigrants from Peru (57.7%, a difference of 0.17%), and Immigrants from Nigeria (57.9%, a difference of 0.18%).
| Demographics | Rating | Rank | College, 1 year or more |
| Immigrants | Zaire | 18.7 /100 | #205 | Poor 58.3% |
| Immigrants | Vietnam | 18.2 /100 | #206 | Poor 58.2% |
| Senegalese | 16.9 /100 | #207 | Poor 58.2% |
| Immigrants | Uruguay | 15.2 /100 | #208 | Poor 58.1% |
| Immigrants | Middle Africa | 14.0 /100 | #209 | Poor 58.0% |
| Tsimshian | 13.5 /100 | #210 | Poor 57.9% |
| Immigrants | Nigeria | 13.3 /100 | #211 | Poor 57.9% |
| Immigrants | Senegal | 11.8 /100 | #212 | Poor 57.8% |
| French Canadians | 11.8 /100 | #213 | Poor 57.8% |
| Immigrants | Colombia | 11.6 /100 | #214 | Poor 57.8% |
| Tongans | 11.6 /100 | #215 | Poor 57.8% |
| Immigrants | Peru | 10.6 /100 | #216 | Poor 57.7% |
| Immigrants | Panama | 9.1 /100 | #217 | Tragic 57.6% |
| Native Hawaiians | 9.0 /100 | #218 | Tragic 57.6% |
| Whites/Caucasians | 8.7 /100 | #219 | Tragic 57.6% |
Demographics Similar to Czechs by College, 1 year or more
In terms of college, 1 year or more, the demographic groups most similar to Czechs are Slavic (60.6%, a difference of 0.070%), Polish (60.7%, a difference of 0.080%), Canadian (60.6%, a difference of 0.080%), Immigrants from Afghanistan (60.7%, a difference of 0.11%), and Iraqi (60.7%, a difference of 0.13%).
| Demographics | Rating | Rank | College, 1 year or more |
| Slovenes | 86.5 /100 | #137 | Excellent 60.9% |
| Taiwanese | 84.3 /100 | #138 | Excellent 60.7% |
| Immigrants | Eritrea | 84.3 /100 | #139 | Excellent 60.7% |
| Iraqis | 83.3 /100 | #140 | Excellent 60.7% |
| Immigrants | Afghanistan | 83.1 /100 | #141 | Excellent 60.7% |
| Poles | 82.8 /100 | #142 | Excellent 60.7% |
| Canadians | 82.7 /100 | #143 | Excellent 60.6% |
| Czechs | 81.9 /100 | #144 | Excellent 60.6% |
| Slavs | 81.1 /100 | #145 | Excellent 60.6% |
| Scottish | 80.2 /100 | #146 | Excellent 60.5% |
| Immigrants | Kenya | 79.1 /100 | #147 | Good 60.5% |
| Kenyans | 79.0 /100 | #148 | Good 60.5% |
| Brazilians | 79.0 /100 | #149 | Good 60.5% |
| Immigrants | Sudan | 77.8 /100 | #150 | Good 60.4% |
| Albanians | 77.8 /100 | #151 | Good 60.4% |