Tongan vs Blackfeet College, 1 year or more
COMPARE
Tongan
Blackfeet
College, 1 year or more
College, 1 year or more Comparison
Tongans
Blackfeet
57.8%
COLLEGE, 1 YEAR OR MORE
11.6/ 100
METRIC RATING
215th/ 347
METRIC RANK
54.6%
COLLEGE, 1 YEAR OR MORE
0.2/ 100
METRIC RATING
267th/ 347
METRIC RANK
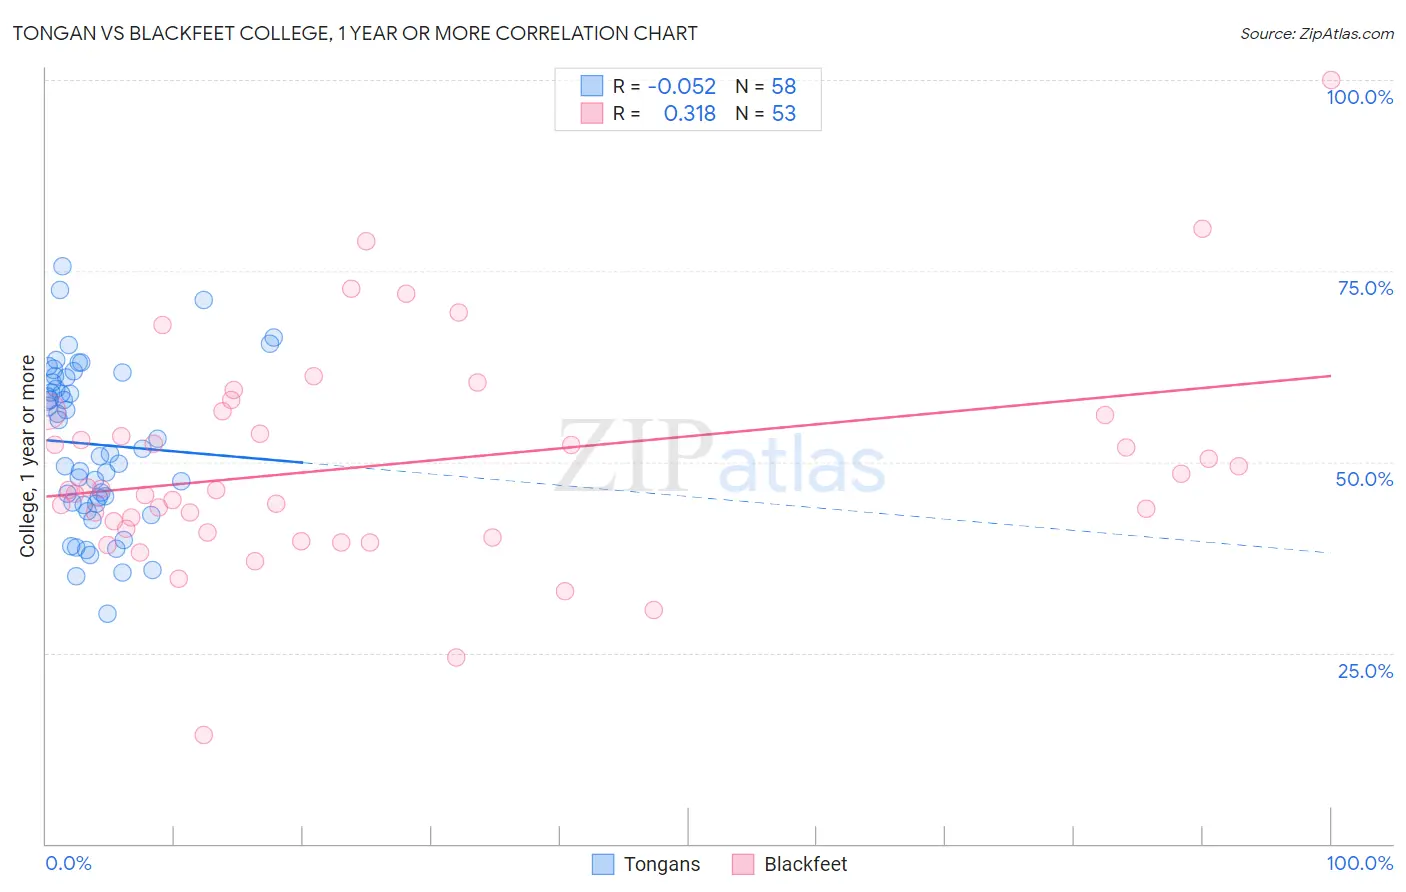
Tongan vs Blackfeet College, 1 year or more Correlation Chart
The statistical analysis conducted on geographies consisting of 102,908,759 people shows a slight negative correlation between the proportion of Tongans and percentage of population with at least college, 1 year or more education in the United States with a correlation coefficient (R) of -0.052 and weighted average of 57.8%. Similarly, the statistical analysis conducted on geographies consisting of 309,581,710 people shows a mild positive correlation between the proportion of Blackfeet and percentage of population with at least college, 1 year or more education in the United States with a correlation coefficient (R) of 0.318 and weighted average of 54.6%, a difference of 5.9%.
College, 1 year or more Correlation Summary
| Measurement | Tongan | Blackfeet |
| Minimum | 30.2% | 14.2% |
| Maximum | 75.6% | 100.0% |
| Range | 45.4% | 85.8% |
| Mean | 52.3% | 49.6% |
| Median | 51.4% | 46.3% |
| Interquartile 25% (IQ1) | 44.5% | 40.9% |
| Interquartile 75% (IQ3) | 61.1% | 56.4% |
| Interquartile Range (IQR) | 16.6% | 15.4% |
| Standard Deviation (Sample) | 10.5% | 14.4% |
| Standard Deviation (Population) | 10.5% | 14.3% |
Similar Demographics by College, 1 year or more
Demographics Similar to Tongans by College, 1 year or more
In terms of college, 1 year or more, the demographic groups most similar to Tongans are Immigrants from Colombia (57.8%, a difference of 0.0%), Immigrants from Senegal (57.8%, a difference of 0.040%), French Canadian (57.8%, a difference of 0.040%), Immigrants from Peru (57.7%, a difference of 0.13%), and Immigrants from Nigeria (57.9%, a difference of 0.21%).
| Demographics | Rating | Rank | College, 1 year or more |
| Immigrants | Uruguay | 15.2 /100 | #208 | Poor 58.1% |
| Immigrants | Middle Africa | 14.0 /100 | #209 | Poor 58.0% |
| Tsimshian | 13.5 /100 | #210 | Poor 57.9% |
| Immigrants | Nigeria | 13.3 /100 | #211 | Poor 57.9% |
| Immigrants | Senegal | 11.8 /100 | #212 | Poor 57.8% |
| French Canadians | 11.8 /100 | #213 | Poor 57.8% |
| Immigrants | Colombia | 11.6 /100 | #214 | Poor 57.8% |
| Tongans | 11.6 /100 | #215 | Poor 57.8% |
| Immigrants | Peru | 10.6 /100 | #216 | Poor 57.7% |
| Immigrants | Panama | 9.1 /100 | #217 | Tragic 57.6% |
| Native Hawaiians | 9.0 /100 | #218 | Tragic 57.6% |
| Whites/Caucasians | 8.7 /100 | #219 | Tragic 57.6% |
| Immigrants | Costa Rica | 8.0 /100 | #220 | Tragic 57.5% |
| Immigrants | Ghana | 7.7 /100 | #221 | Tragic 57.4% |
| Sub-Saharan Africans | 6.1 /100 | #222 | Tragic 57.3% |
Demographics Similar to Blackfeet by College, 1 year or more
In terms of college, 1 year or more, the demographic groups most similar to Blackfeet are Potawatomi (54.6%, a difference of 0.070%), Immigrants from Laos (54.7%, a difference of 0.12%), British West Indian (54.5%, a difference of 0.16%), Bangladeshi (54.5%, a difference of 0.19%), and Crow (54.5%, a difference of 0.22%).
| Demographics | Rating | Rank | College, 1 year or more |
| Jamaicans | 0.3 /100 | #260 | Tragic 54.9% |
| Ottawa | 0.3 /100 | #261 | Tragic 54.9% |
| Immigrants | St. Vincent and the Grenadines | 0.3 /100 | #262 | Tragic 54.8% |
| U.S. Virgin Islanders | 0.3 /100 | #263 | Tragic 54.8% |
| Immigrants | Micronesia | 0.3 /100 | #264 | Tragic 54.8% |
| Immigrants | Laos | 0.2 /100 | #265 | Tragic 54.7% |
| Potawatomi | 0.2 /100 | #266 | Tragic 54.6% |
| Blackfeet | 0.2 /100 | #267 | Tragic 54.6% |
| British West Indians | 0.2 /100 | #268 | Tragic 54.5% |
| Bangladeshis | 0.2 /100 | #269 | Tragic 54.5% |
| Crow | 0.2 /100 | #270 | Tragic 54.5% |
| Bahamians | 0.2 /100 | #271 | Tragic 54.5% |
| Comanche | 0.2 /100 | #272 | Tragic 54.4% |
| Immigrants | Grenada | 0.2 /100 | #273 | Tragic 54.4% |
| Belizeans | 0.2 /100 | #274 | Tragic 54.4% |