Cheyenne vs Blackfeet College, 1 year or more
COMPARE
Cheyenne
Blackfeet
College, 1 year or more
College, 1 year or more Comparison
Cheyenne
Blackfeet
54.1%
COLLEGE, 1 YEAR OR MORE
0.1/ 100
METRIC RATING
280th/ 347
METRIC RANK
54.6%
COLLEGE, 1 YEAR OR MORE
0.2/ 100
METRIC RATING
267th/ 347
METRIC RANK
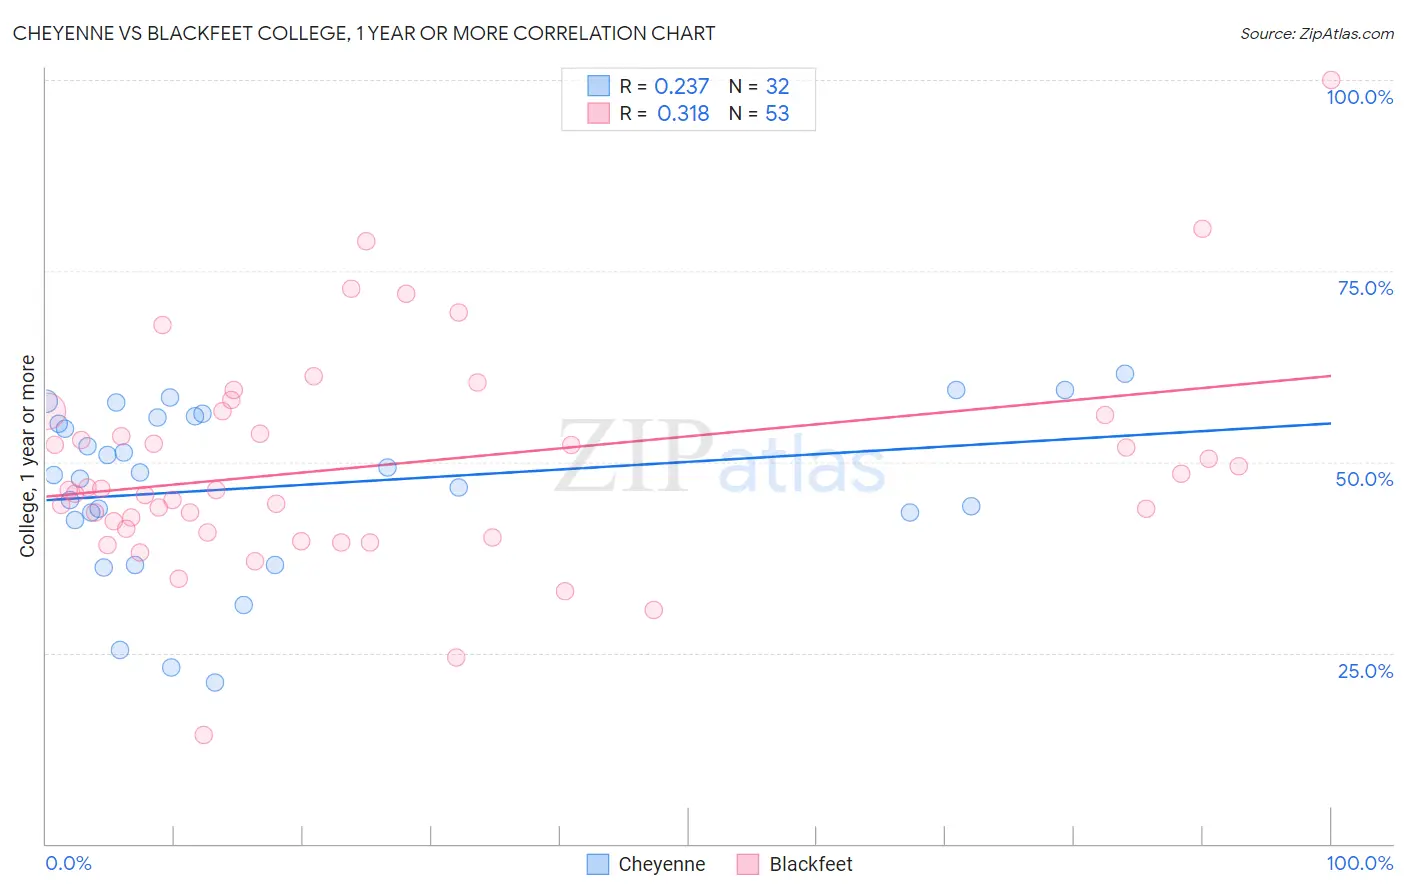
Cheyenne vs Blackfeet College, 1 year or more Correlation Chart
The statistical analysis conducted on geographies consisting of 80,719,187 people shows a weak positive correlation between the proportion of Cheyenne and percentage of population with at least college, 1 year or more education in the United States with a correlation coefficient (R) of 0.237 and weighted average of 54.1%. Similarly, the statistical analysis conducted on geographies consisting of 309,581,710 people shows a mild positive correlation between the proportion of Blackfeet and percentage of population with at least college, 1 year or more education in the United States with a correlation coefficient (R) of 0.318 and weighted average of 54.6%, a difference of 0.92%.
College, 1 year or more Correlation Summary
| Measurement | Cheyenne | Blackfeet |
| Minimum | 21.1% | 14.2% |
| Maximum | 61.5% | 100.0% |
| Range | 40.3% | 85.8% |
| Mean | 46.8% | 49.6% |
| Median | 48.5% | 46.3% |
| Interquartile 25% (IQ1) | 42.9% | 40.9% |
| Interquartile 75% (IQ3) | 55.9% | 56.4% |
| Interquartile Range (IQR) | 13.0% | 15.4% |
| Standard Deviation (Sample) | 10.9% | 14.4% |
| Standard Deviation (Population) | 10.7% | 14.3% |
Demographics Similar to Cheyenne and Blackfeet by College, 1 year or more
In terms of college, 1 year or more, the demographic groups most similar to Cheyenne are Colville (54.1%, a difference of 0.010%), Guyanese (54.1%, a difference of 0.050%), Arapaho (54.1%, a difference of 0.060%), Immigrants from Jamaica (54.2%, a difference of 0.070%), and Ecuadorian (54.3%, a difference of 0.39%). Similarly, the demographic groups most similar to Blackfeet are Potawatomi (54.6%, a difference of 0.070%), Immigrants from Laos (54.7%, a difference of 0.12%), British West Indian (54.5%, a difference of 0.16%), Bangladeshi (54.5%, a difference of 0.19%), and Crow (54.5%, a difference of 0.22%).
| Demographics | Rating | Rank | College, 1 year or more |
| U.S. Virgin Islanders | 0.3 /100 | #263 | Tragic 54.8% |
| Immigrants | Micronesia | 0.3 /100 | #264 | Tragic 54.8% |
| Immigrants | Laos | 0.2 /100 | #265 | Tragic 54.7% |
| Potawatomi | 0.2 /100 | #266 | Tragic 54.6% |
| Blackfeet | 0.2 /100 | #267 | Tragic 54.6% |
| British West Indians | 0.2 /100 | #268 | Tragic 54.5% |
| Bangladeshis | 0.2 /100 | #269 | Tragic 54.5% |
| Crow | 0.2 /100 | #270 | Tragic 54.5% |
| Bahamians | 0.2 /100 | #271 | Tragic 54.5% |
| Comanche | 0.2 /100 | #272 | Tragic 54.4% |
| Immigrants | Grenada | 0.2 /100 | #273 | Tragic 54.4% |
| Belizeans | 0.2 /100 | #274 | Tragic 54.4% |
| Americans | 0.2 /100 | #275 | Tragic 54.4% |
| Shoshone | 0.2 /100 | #276 | Tragic 54.3% |
| Ecuadorians | 0.2 /100 | #277 | Tragic 54.3% |
| Immigrants | Jamaica | 0.1 /100 | #278 | Tragic 54.2% |
| Arapaho | 0.1 /100 | #279 | Tragic 54.1% |
| Cheyenne | 0.1 /100 | #280 | Tragic 54.1% |
| Colville | 0.1 /100 | #281 | Tragic 54.1% |
| Guyanese | 0.1 /100 | #282 | Tragic 54.1% |
| Nicaraguans | 0.1 /100 | #283 | Tragic 53.9% |