Tongan vs Ghanaian College, 1 year or more
COMPARE
Tongan
Ghanaian
College, 1 year or more
College, 1 year or more Comparison
Tongans
Ghanaians
57.8%
COLLEGE, 1 YEAR OR MORE
11.6/ 100
METRIC RATING
215th/ 347
METRIC RANK
58.4%
COLLEGE, 1 YEAR OR MORE
20.9/ 100
METRIC RATING
203rd/ 347
METRIC RANK
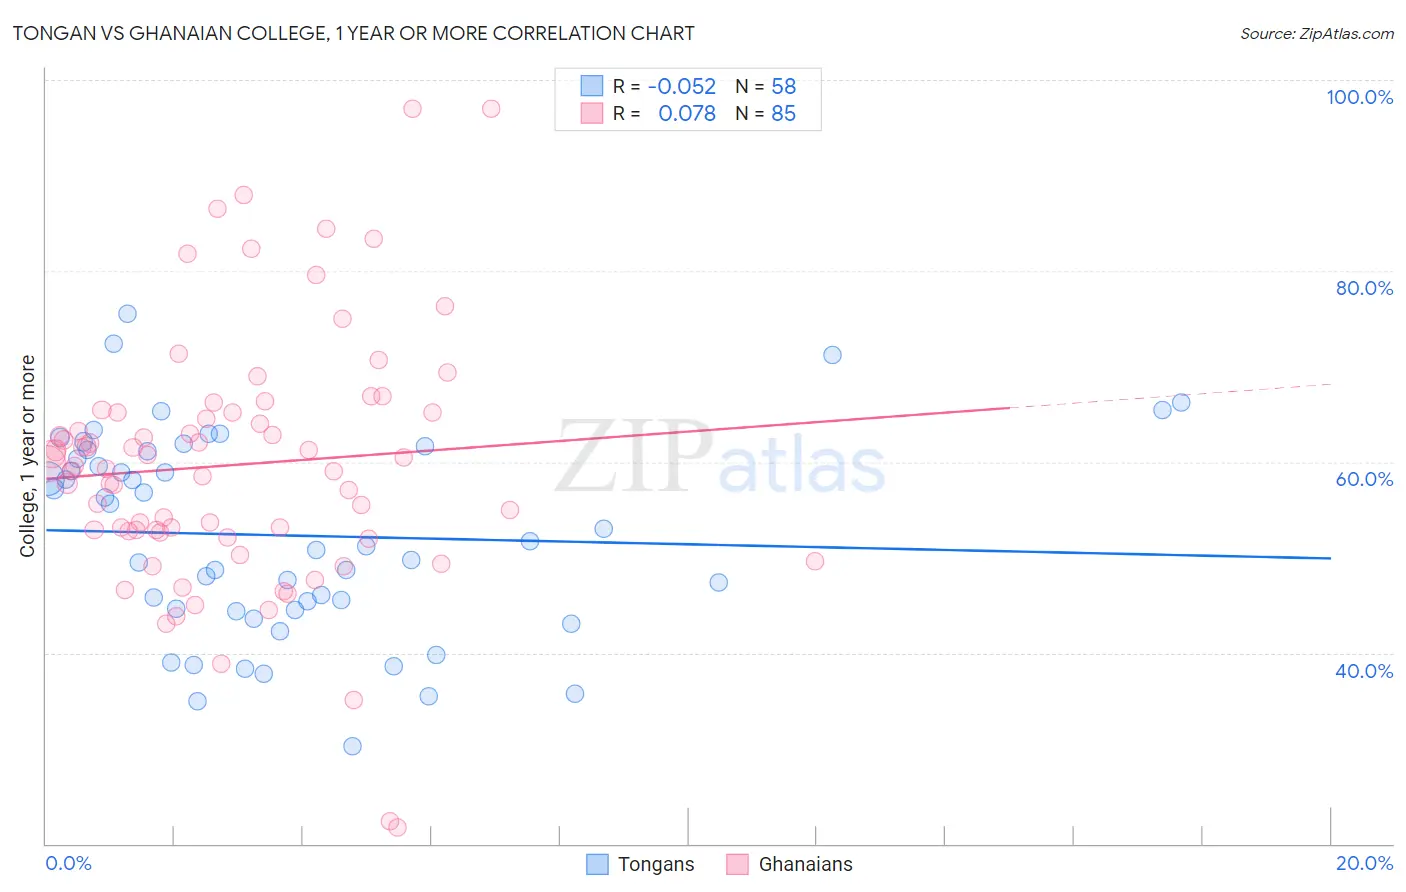
Tongan vs Ghanaian College, 1 year or more Correlation Chart
The statistical analysis conducted on geographies consisting of 102,908,759 people shows a slight negative correlation between the proportion of Tongans and percentage of population with at least college, 1 year or more education in the United States with a correlation coefficient (R) of -0.052 and weighted average of 57.8%. Similarly, the statistical analysis conducted on geographies consisting of 190,712,650 people shows a slight positive correlation between the proportion of Ghanaians and percentage of population with at least college, 1 year or more education in the United States with a correlation coefficient (R) of 0.078 and weighted average of 58.4%, a difference of 0.96%.
College, 1 year or more Correlation Summary
| Measurement | Tongan | Ghanaian |
| Minimum | 30.2% | 21.7% |
| Maximum | 75.6% | 97.0% |
| Range | 45.4% | 75.4% |
| Mean | 52.3% | 59.7% |
| Median | 51.4% | 59.6% |
| Interquartile 25% (IQ1) | 44.5% | 52.7% |
| Interquartile 75% (IQ3) | 61.1% | 65.2% |
| Interquartile Range (IQR) | 16.6% | 12.5% |
| Standard Deviation (Sample) | 10.5% | 13.4% |
| Standard Deviation (Population) | 10.5% | 13.4% |
Demographics Similar to Tongans and Ghanaians by College, 1 year or more
In terms of college, 1 year or more, the demographic groups most similar to Tongans are Immigrants from Colombia (57.8%, a difference of 0.0%), Immigrants from Senegal (57.8%, a difference of 0.040%), French Canadian (57.8%, a difference of 0.040%), Immigrants from Peru (57.7%, a difference of 0.13%), and Immigrants from Nigeria (57.9%, a difference of 0.21%). Similarly, the demographic groups most similar to Ghanaians are Immigrants from South America (58.4%, a difference of 0.090%), Panamanian (58.3%, a difference of 0.14%), Nigerian (58.5%, a difference of 0.17%), Immigrants from Zaire (58.3%, a difference of 0.19%), and Immigrants from Vietnam (58.2%, a difference of 0.23%).
| Demographics | Rating | Rank | College, 1 year or more |
| Slovaks | 24.6 /100 | #199 | Fair 58.5% |
| Spanish | 24.2 /100 | #200 | Fair 58.5% |
| Nigerians | 23.0 /100 | #201 | Fair 58.5% |
| Immigrants | South America | 21.9 /100 | #202 | Fair 58.4% |
| Ghanaians | 20.9 /100 | #203 | Fair 58.4% |
| Panamanians | 19.2 /100 | #204 | Poor 58.3% |
| Immigrants | Zaire | 18.7 /100 | #205 | Poor 58.3% |
| Immigrants | Vietnam | 18.2 /100 | #206 | Poor 58.2% |
| Senegalese | 16.9 /100 | #207 | Poor 58.2% |
| Immigrants | Uruguay | 15.2 /100 | #208 | Poor 58.1% |
| Immigrants | Middle Africa | 14.0 /100 | #209 | Poor 58.0% |
| Tsimshian | 13.5 /100 | #210 | Poor 57.9% |
| Immigrants | Nigeria | 13.3 /100 | #211 | Poor 57.9% |
| Immigrants | Senegal | 11.8 /100 | #212 | Poor 57.8% |
| French Canadians | 11.8 /100 | #213 | Poor 57.8% |
| Immigrants | Colombia | 11.6 /100 | #214 | Poor 57.8% |
| Tongans | 11.6 /100 | #215 | Poor 57.8% |
| Immigrants | Peru | 10.6 /100 | #216 | Poor 57.7% |
| Immigrants | Panama | 9.1 /100 | #217 | Tragic 57.6% |
| Native Hawaiians | 9.0 /100 | #218 | Tragic 57.6% |
| Whites/Caucasians | 8.7 /100 | #219 | Tragic 57.6% |