Hopi vs Blackfeet College, 1 year or more
COMPARE
Hopi
Blackfeet
College, 1 year or more
College, 1 year or more Comparison
Hopi
Blackfeet
50.9%
COLLEGE, 1 YEAR OR MORE
0.0/ 100
METRIC RATING
321st/ 347
METRIC RANK
54.6%
COLLEGE, 1 YEAR OR MORE
0.2/ 100
METRIC RATING
267th/ 347
METRIC RANK
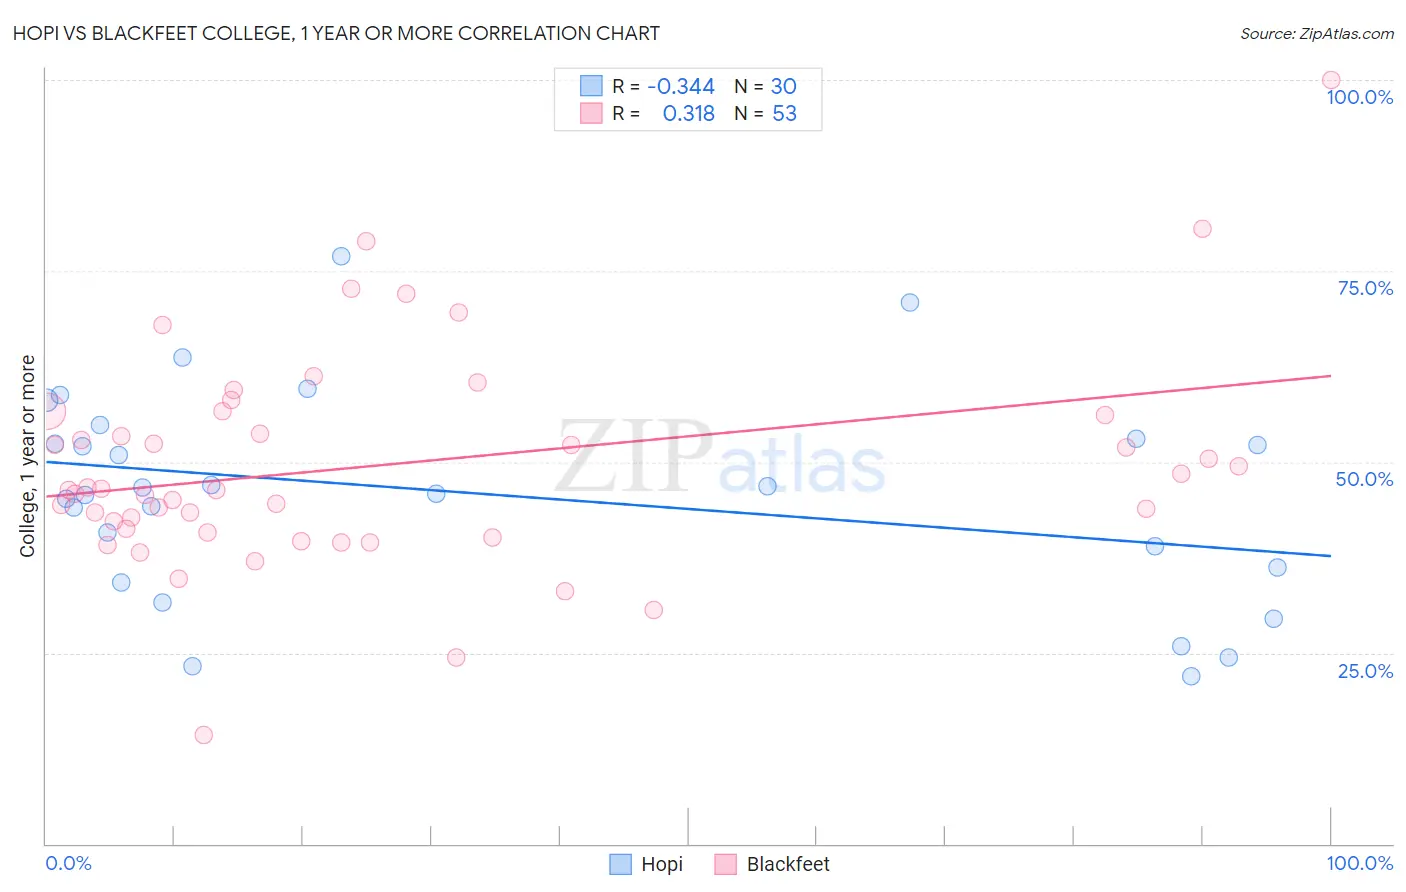
Hopi vs Blackfeet College, 1 year or more Correlation Chart
The statistical analysis conducted on geographies consisting of 74,740,168 people shows a mild negative correlation between the proportion of Hopi and percentage of population with at least college, 1 year or more education in the United States with a correlation coefficient (R) of -0.344 and weighted average of 50.9%. Similarly, the statistical analysis conducted on geographies consisting of 309,581,710 people shows a mild positive correlation between the proportion of Blackfeet and percentage of population with at least college, 1 year or more education in the United States with a correlation coefficient (R) of 0.318 and weighted average of 54.6%, a difference of 7.3%.
College, 1 year or more Correlation Summary
| Measurement | Hopi | Blackfeet |
| Minimum | 21.9% | 14.2% |
| Maximum | 76.9% | 100.0% |
| Range | 55.0% | 85.8% |
| Mean | 45.8% | 49.6% |
| Median | 46.2% | 46.3% |
| Interquartile 25% (IQ1) | 36.2% | 40.9% |
| Interquartile 75% (IQ3) | 53.0% | 56.4% |
| Interquartile Range (IQR) | 16.9% | 15.4% |
| Standard Deviation (Sample) | 13.7% | 14.4% |
| Standard Deviation (Population) | 13.4% | 14.3% |
Similar Demographics by College, 1 year or more
Demographics Similar to Hopi by College, 1 year or more
In terms of college, 1 year or more, the demographic groups most similar to Hopi are Kiowa (51.0%, a difference of 0.12%), Navajo (50.8%, a difference of 0.18%), Immigrants from El Salvador (51.0%, a difference of 0.19%), Immigrants from Honduras (51.0%, a difference of 0.27%), and Hispanic or Latino (51.1%, a difference of 0.40%).
| Demographics | Rating | Rank | College, 1 year or more |
| Fijians | 0.0 /100 | #314 | Tragic 51.3% |
| Guatemalans | 0.0 /100 | #315 | Tragic 51.2% |
| Cajuns | 0.0 /100 | #316 | Tragic 51.2% |
| Hispanics or Latinos | 0.0 /100 | #317 | Tragic 51.1% |
| Immigrants | Honduras | 0.0 /100 | #318 | Tragic 51.0% |
| Immigrants | El Salvador | 0.0 /100 | #319 | Tragic 51.0% |
| Kiowa | 0.0 /100 | #320 | Tragic 51.0% |
| Hopi | 0.0 /100 | #321 | Tragic 50.9% |
| Navajo | 0.0 /100 | #322 | Tragic 50.8% |
| Immigrants | Guatemala | 0.0 /100 | #323 | Tragic 50.7% |
| Immigrants | Cuba | 0.0 /100 | #324 | Tragic 50.7% |
| Immigrants | Latin America | 0.0 /100 | #325 | Tragic 50.7% |
| Dominicans | 0.0 /100 | #326 | Tragic 50.6% |
| Menominee | 0.0 /100 | #327 | Tragic 50.6% |
| Dutch West Indians | 0.0 /100 | #328 | Tragic 50.5% |
Demographics Similar to Blackfeet by College, 1 year or more
In terms of college, 1 year or more, the demographic groups most similar to Blackfeet are Potawatomi (54.6%, a difference of 0.070%), Immigrants from Laos (54.7%, a difference of 0.12%), British West Indian (54.5%, a difference of 0.16%), Bangladeshi (54.5%, a difference of 0.19%), and Crow (54.5%, a difference of 0.22%).
| Demographics | Rating | Rank | College, 1 year or more |
| Jamaicans | 0.3 /100 | #260 | Tragic 54.9% |
| Ottawa | 0.3 /100 | #261 | Tragic 54.9% |
| Immigrants | St. Vincent and the Grenadines | 0.3 /100 | #262 | Tragic 54.8% |
| U.S. Virgin Islanders | 0.3 /100 | #263 | Tragic 54.8% |
| Immigrants | Micronesia | 0.3 /100 | #264 | Tragic 54.8% |
| Immigrants | Laos | 0.2 /100 | #265 | Tragic 54.7% |
| Potawatomi | 0.2 /100 | #266 | Tragic 54.6% |
| Blackfeet | 0.2 /100 | #267 | Tragic 54.6% |
| British West Indians | 0.2 /100 | #268 | Tragic 54.5% |
| Bangladeshis | 0.2 /100 | #269 | Tragic 54.5% |
| Crow | 0.2 /100 | #270 | Tragic 54.5% |
| Bahamians | 0.2 /100 | #271 | Tragic 54.5% |
| Comanche | 0.2 /100 | #272 | Tragic 54.4% |
| Immigrants | Grenada | 0.2 /100 | #273 | Tragic 54.4% |
| Belizeans | 0.2 /100 | #274 | Tragic 54.4% |