Tongan vs Blackfeet Unemployment Among Youth under 25 years
COMPARE
Tongan
Blackfeet
Unemployment Among Youth under 25 years
Unemployment Among Youth under 25 years Comparison
Tongans
Blackfeet
10.9%
UNEMPLOYMENT AMONG YOUTH UNDER 25 YEARS
99.6/ 100
METRIC RATING
46th/ 347
METRIC RANK
13.3%
UNEMPLOYMENT AMONG YOUTH UNDER 25 YEARS
0.0/ 100
METRIC RATING
286th/ 347
METRIC RANK
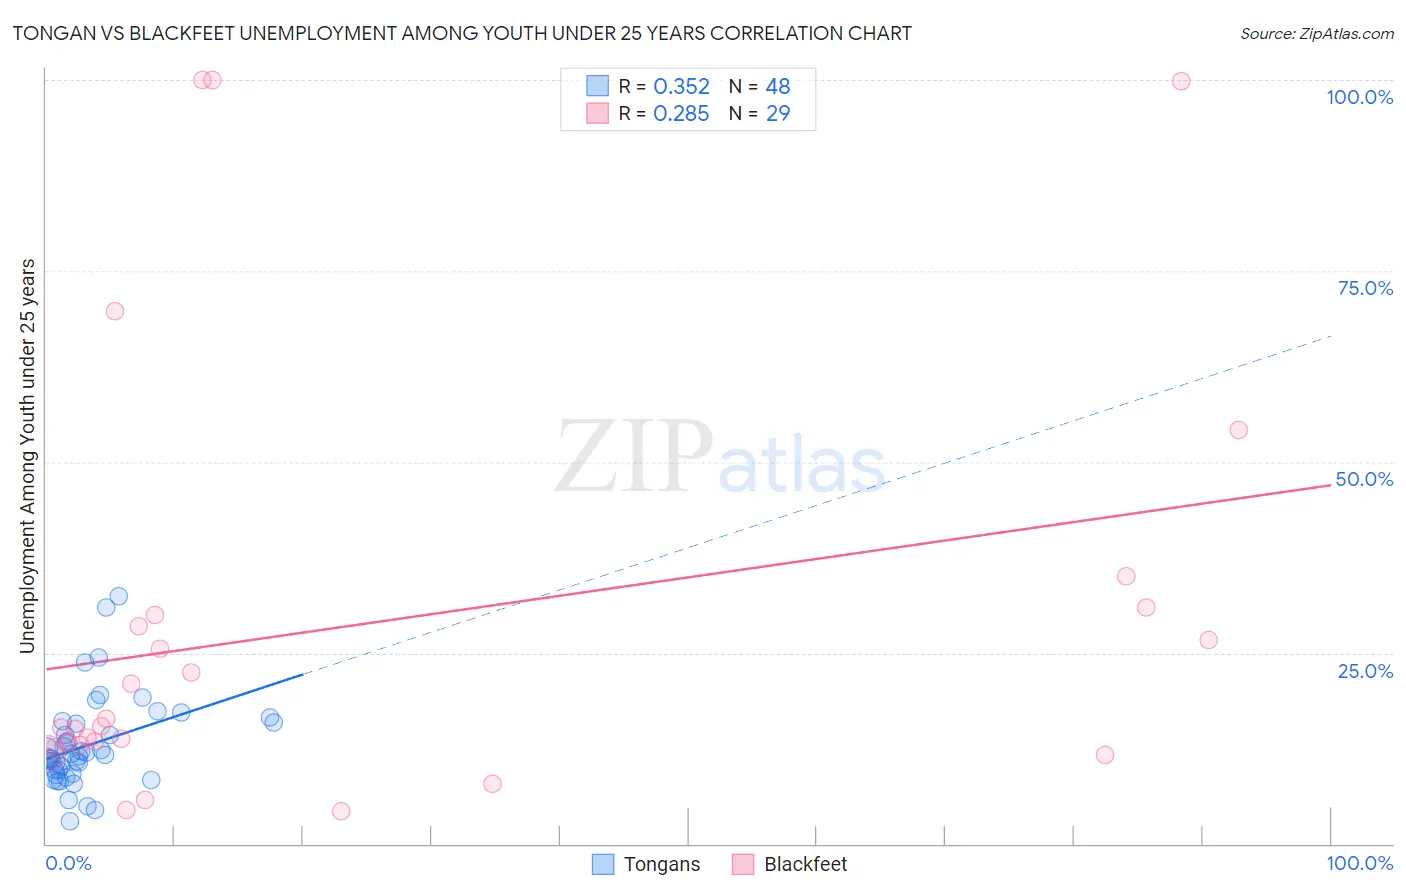
Tongan vs Blackfeet Unemployment Among Youth under 25 years Correlation Chart
The statistical analysis conducted on geographies consisting of 102,589,279 people shows a mild positive correlation between the proportion of Tongans and unemployment rate among youth under the age of 25 in the United States with a correlation coefficient (R) of 0.352 and weighted average of 10.9%. Similarly, the statistical analysis conducted on geographies consisting of 306,373,464 people shows a weak positive correlation between the proportion of Blackfeet and unemployment rate among youth under the age of 25 in the United States with a correlation coefficient (R) of 0.285 and weighted average of 13.3%, a difference of 21.6%.
Unemployment Among Youth under 25 years Correlation Summary
| Measurement | Tongan | Blackfeet |
| Minimum | 2.9% | 4.2% |
| Maximum | 32.4% | 100.0% |
| Range | 29.5% | 95.8% |
| Mean | 12.9% | 28.6% |
| Median | 11.5% | 15.4% |
| Interquartile 25% (IQ1) | 9.4% | 12.8% |
| Interquartile 75% (IQ3) | 15.8% | 30.4% |
| Interquartile Range (IQR) | 6.4% | 17.7% |
| Standard Deviation (Sample) | 6.0% | 28.4% |
| Standard Deviation (Population) | 5.9% | 27.9% |
Similar Demographics by Unemployment Among Youth under 25 years
Demographics Similar to Tongans by Unemployment Among Youth under 25 years
In terms of unemployment among youth under 25 years, the demographic groups most similar to Tongans are Bulgarian (10.9%, a difference of 0.040%), Australian (10.9%, a difference of 0.040%), Welsh (10.9%, a difference of 0.14%), British (10.9%, a difference of 0.17%), and Cambodian (10.9%, a difference of 0.42%).
| Demographics | Rating | Rank | Unemployment Among Youth under 25 years |
| Immigrants | Zaire | 99.8 /100 | #39 | Exceptional 10.9% |
| Scottish | 99.8 /100 | #40 | Exceptional 10.9% |
| Croatians | 99.8 /100 | #41 | Exceptional 10.9% |
| Cambodians | 99.7 /100 | #42 | Exceptional 10.9% |
| British | 99.7 /100 | #43 | Exceptional 10.9% |
| Welsh | 99.7 /100 | #44 | Exceptional 10.9% |
| Bulgarians | 99.6 /100 | #45 | Exceptional 10.9% |
| Tongans | 99.6 /100 | #46 | Exceptional 10.9% |
| Australians | 99.6 /100 | #47 | Exceptional 10.9% |
| Poles | 99.3 /100 | #48 | Exceptional 11.0% |
| Thais | 99.3 /100 | #49 | Exceptional 11.0% |
| Czechoslovakians | 99.2 /100 | #50 | Exceptional 11.0% |
| Serbians | 99.0 /100 | #51 | Exceptional 11.0% |
| Latvians | 99.0 /100 | #52 | Exceptional 11.0% |
| Ottawa | 99.0 /100 | #53 | Exceptional 11.1% |
Demographics Similar to Blackfeet by Unemployment Among Youth under 25 years
In terms of unemployment among youth under 25 years, the demographic groups most similar to Blackfeet are Ecuadorian (13.3%, a difference of 0.010%), Ghanaian (13.3%, a difference of 0.050%), Lumbee (13.3%, a difference of 0.14%), Immigrants from Cameroon (13.3%, a difference of 0.15%), and Sierra Leonean (13.3%, a difference of 0.17%).
| Demographics | Rating | Rank | Unemployment Among Youth under 25 years |
| Cajuns | 0.0 /100 | #279 | Tragic 13.2% |
| Ute | 0.0 /100 | #280 | Tragic 13.3% |
| Armenians | 0.0 /100 | #281 | Tragic 13.3% |
| Sierra Leoneans | 0.0 /100 | #282 | Tragic 13.3% |
| Immigrants | Cameroon | 0.0 /100 | #283 | Tragic 13.3% |
| Lumbee | 0.0 /100 | #284 | Tragic 13.3% |
| Ghanaians | 0.0 /100 | #285 | Tragic 13.3% |
| Blackfeet | 0.0 /100 | #286 | Tragic 13.3% |
| Ecuadorians | 0.0 /100 | #287 | Tragic 13.3% |
| Immigrants | Western Africa | 0.0 /100 | #288 | Tragic 13.4% |
| Immigrants | Ghana | 0.0 /100 | #289 | Tragic 13.4% |
| Immigrants | Ecuador | 0.0 /100 | #290 | Tragic 13.4% |
| Apache | 0.0 /100 | #291 | Tragic 13.5% |
| Central American Indians | 0.0 /100 | #292 | Tragic 13.5% |
| Spanish American Indians | 0.0 /100 | #293 | Tragic 13.5% |