Immigrants from Romania vs Blackfeet College, 1 year or more
COMPARE
Immigrants from Romania
Blackfeet
College, 1 year or more
College, 1 year or more Comparison
Immigrants from Romania
Blackfeet
63.3%
COLLEGE, 1 YEAR OR MORE
99.3/ 100
METRIC RATING
67th/ 347
METRIC RANK
54.6%
COLLEGE, 1 YEAR OR MORE
0.2/ 100
METRIC RATING
267th/ 347
METRIC RANK
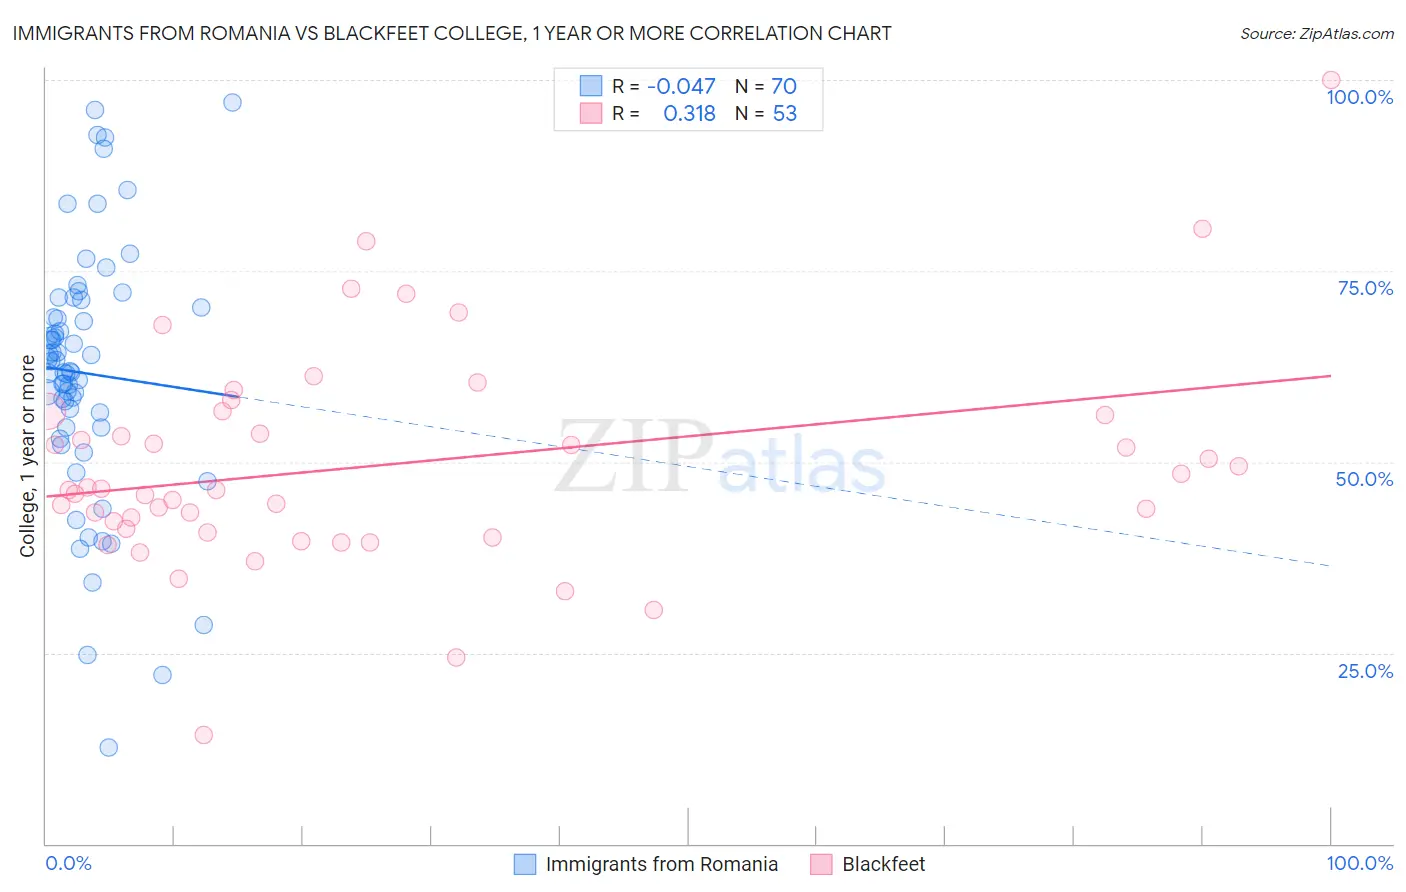
Immigrants from Romania vs Blackfeet College, 1 year or more Correlation Chart
The statistical analysis conducted on geographies consisting of 257,014,354 people shows no correlation between the proportion of Immigrants from Romania and percentage of population with at least college, 1 year or more education in the United States with a correlation coefficient (R) of -0.047 and weighted average of 63.3%. Similarly, the statistical analysis conducted on geographies consisting of 309,581,710 people shows a mild positive correlation between the proportion of Blackfeet and percentage of population with at least college, 1 year or more education in the United States with a correlation coefficient (R) of 0.318 and weighted average of 54.6%, a difference of 15.9%.
College, 1 year or more Correlation Summary
| Measurement | Immigrants from Romania | Blackfeet |
| Minimum | 12.7% | 14.2% |
| Maximum | 97.0% | 100.0% |
| Range | 84.3% | 85.8% |
| Mean | 61.6% | 49.6% |
| Median | 62.6% | 46.3% |
| Interquartile 25% (IQ1) | 54.6% | 40.9% |
| Interquartile 75% (IQ3) | 70.2% | 56.4% |
| Interquartile Range (IQR) | 15.6% | 15.4% |
| Standard Deviation (Sample) | 16.7% | 14.4% |
| Standard Deviation (Population) | 16.5% | 14.3% |
Similar Demographics by College, 1 year or more
Demographics Similar to Immigrants from Romania by College, 1 year or more
In terms of college, 1 year or more, the demographic groups most similar to Immigrants from Romania are Immigrants from Europe (63.3%, a difference of 0.020%), Immigrants from Greece (63.3%, a difference of 0.020%), Immigrants from Zimbabwe (63.3%, a difference of 0.020%), Maltese (63.4%, a difference of 0.12%), and Argentinean (63.2%, a difference of 0.12%).
| Demographics | Rating | Rank | College, 1 year or more |
| Immigrants | Kazakhstan | 99.5 /100 | #60 | Exceptional 63.6% |
| Bolivians | 99.5 /100 | #61 | Exceptional 63.5% |
| Immigrants | Indonesia | 99.5 /100 | #62 | Exceptional 63.5% |
| Immigrants | Scotland | 99.4 /100 | #63 | Exceptional 63.4% |
| Immigrants | Spain | 99.4 /100 | #64 | Exceptional 63.4% |
| Maltese | 99.3 /100 | #65 | Exceptional 63.4% |
| Immigrants | Europe | 99.3 /100 | #66 | Exceptional 63.3% |
| Immigrants | Romania | 99.3 /100 | #67 | Exceptional 63.3% |
| Immigrants | Greece | 99.3 /100 | #68 | Exceptional 63.3% |
| Immigrants | Zimbabwe | 99.3 /100 | #69 | Exceptional 63.3% |
| Argentineans | 99.2 /100 | #70 | Exceptional 63.2% |
| Immigrants | Canada | 99.1 /100 | #71 | Exceptional 63.1% |
| Egyptians | 99.0 /100 | #72 | Exceptional 63.1% |
| Immigrants | Moldova | 99.0 /100 | #73 | Exceptional 63.0% |
| Immigrants | North America | 99.0 /100 | #74 | Exceptional 63.0% |
Demographics Similar to Blackfeet by College, 1 year or more
In terms of college, 1 year or more, the demographic groups most similar to Blackfeet are Potawatomi (54.6%, a difference of 0.070%), Immigrants from Laos (54.7%, a difference of 0.12%), British West Indian (54.5%, a difference of 0.16%), Bangladeshi (54.5%, a difference of 0.19%), and Crow (54.5%, a difference of 0.22%).
| Demographics | Rating | Rank | College, 1 year or more |
| Jamaicans | 0.3 /100 | #260 | Tragic 54.9% |
| Ottawa | 0.3 /100 | #261 | Tragic 54.9% |
| Immigrants | St. Vincent and the Grenadines | 0.3 /100 | #262 | Tragic 54.8% |
| U.S. Virgin Islanders | 0.3 /100 | #263 | Tragic 54.8% |
| Immigrants | Micronesia | 0.3 /100 | #264 | Tragic 54.8% |
| Immigrants | Laos | 0.2 /100 | #265 | Tragic 54.7% |
| Potawatomi | 0.2 /100 | #266 | Tragic 54.6% |
| Blackfeet | 0.2 /100 | #267 | Tragic 54.6% |
| British West Indians | 0.2 /100 | #268 | Tragic 54.5% |
| Bangladeshis | 0.2 /100 | #269 | Tragic 54.5% |
| Crow | 0.2 /100 | #270 | Tragic 54.5% |
| Bahamians | 0.2 /100 | #271 | Tragic 54.5% |
| Comanche | 0.2 /100 | #272 | Tragic 54.4% |
| Immigrants | Grenada | 0.2 /100 | #273 | Tragic 54.4% |
| Belizeans | 0.2 /100 | #274 | Tragic 54.4% |