Tongan vs Blackfeet In Labor Force | Age 25-29
COMPARE
Tongan
Blackfeet
In Labor Force | Age 25-29
In Labor Force | Age 25-29 Comparison
Tongans
Blackfeet
84.7%
IN LABOR FORCE | AGE 25-29
52.4/ 100
METRIC RATING
170th/ 347
METRIC RANK
82.6%
IN LABOR FORCE | AGE 25-29
0.0/ 100
METRIC RATING
306th/ 347
METRIC RANK
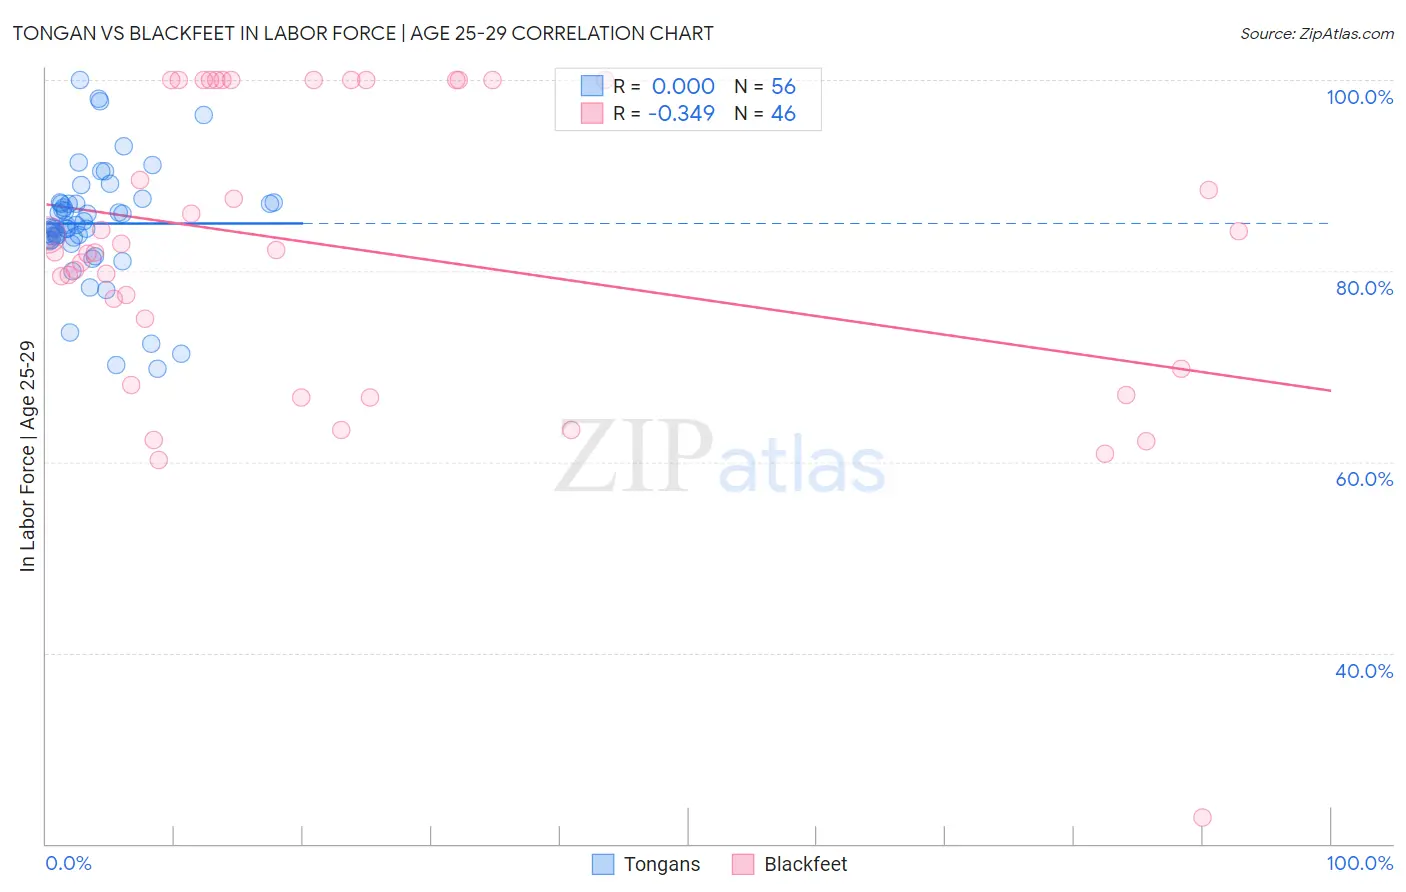
Tongan vs Blackfeet In Labor Force | Age 25-29 Correlation Chart
The statistical analysis conducted on geographies consisting of 102,903,865 people shows no correlation between the proportion of Tongans and labor force participation rate among population between the ages 25 and 29 in the United States with a correlation coefficient (R) of 0.000 and weighted average of 84.7%. Similarly, the statistical analysis conducted on geographies consisting of 309,474,956 people shows a mild negative correlation between the proportion of Blackfeet and labor force participation rate among population between the ages 25 and 29 in the United States with a correlation coefficient (R) of -0.349 and weighted average of 82.6%, a difference of 2.5%.
In Labor Force | Age 25-29 Correlation Summary
| Measurement | Tongan | Blackfeet |
| Minimum | 69.7% | 22.7% |
| Maximum | 100.0% | 100.0% |
| Range | 30.3% | 77.3% |
| Mean | 85.0% | 82.1% |
| Median | 84.7% | 82.1% |
| Interquartile 25% (IQ1) | 83.3% | 69.8% |
| Interquartile 75% (IQ3) | 87.1% | 100.0% |
| Interquartile Range (IQR) | 3.8% | 30.2% |
| Standard Deviation (Sample) | 6.2% | 16.2% |
| Standard Deviation (Population) | 6.1% | 16.0% |
Similar Demographics by In Labor Force | Age 25-29
Demographics Similar to Tongans by In Labor Force | Age 25-29
In terms of in labor force | age 25-29, the demographic groups most similar to Tongans are Celtic (84.7%, a difference of 0.0%), Immigrants from Vietnam (84.7%, a difference of 0.010%), Immigrants from Western Europe (84.7%, a difference of 0.010%), South American (84.7%, a difference of 0.020%), and Assyrian/Chaldean/Syriac (84.7%, a difference of 0.020%).
| Demographics | Rating | Rank | In Labor Force | Age 25-29 |
| Argentineans | 57.9 /100 | #163 | Average 84.7% |
| Ghanaians | 57.6 /100 | #164 | Average 84.7% |
| Immigrants | Burma/Myanmar | 57.4 /100 | #165 | Average 84.7% |
| Immigrants | Spain | 56.9 /100 | #166 | Average 84.7% |
| Indonesians | 56.5 /100 | #167 | Average 84.7% |
| South Americans | 54.9 /100 | #168 | Average 84.7% |
| Celtics | 52.5 /100 | #169 | Average 84.7% |
| Tongans | 52.4 /100 | #170 | Average 84.7% |
| Immigrants | Vietnam | 50.5 /100 | #171 | Average 84.7% |
| Immigrants | Western Europe | 50.4 /100 | #172 | Average 84.7% |
| Assyrians/Chaldeans/Syriacs | 50.2 /100 | #173 | Average 84.7% |
| Palestinians | 50.0 /100 | #174 | Average 84.7% |
| Hungarians | 47.8 /100 | #175 | Average 84.6% |
| Malaysians | 46.8 /100 | #176 | Average 84.6% |
| Immigrants | China | 45.7 /100 | #177 | Average 84.6% |
Demographics Similar to Blackfeet by In Labor Force | Age 25-29
In terms of in labor force | age 25-29, the demographic groups most similar to Blackfeet are Black/African American (82.6%, a difference of 0.010%), Cajun (82.5%, a difference of 0.060%), Immigrants from St. Vincent and the Grenadines (82.7%, a difference of 0.13%), Central American Indian (82.4%, a difference of 0.21%), and Immigrants from Central America (82.4%, a difference of 0.22%).
| Demographics | Rating | Rank | In Labor Force | Age 25-29 |
| Fijians | 0.0 /100 | #299 | Tragic 82.9% |
| Spanish American Indians | 0.0 /100 | #300 | Tragic 82.9% |
| Vietnamese | 0.0 /100 | #301 | Tragic 82.8% |
| Immigrants | Belize | 0.0 /100 | #302 | Tragic 82.8% |
| Immigrants | Grenada | 0.0 /100 | #303 | Tragic 82.8% |
| Immigrants | St. Vincent and the Grenadines | 0.0 /100 | #304 | Tragic 82.7% |
| Blacks/African Americans | 0.0 /100 | #305 | Tragic 82.6% |
| Blackfeet | 0.0 /100 | #306 | Tragic 82.6% |
| Cajuns | 0.0 /100 | #307 | Tragic 82.5% |
| Central American Indians | 0.0 /100 | #308 | Tragic 82.4% |
| Immigrants | Central America | 0.0 /100 | #309 | Tragic 82.4% |
| Osage | 0.0 /100 | #310 | Tragic 82.3% |
| Alaskan Athabascans | 0.0 /100 | #311 | Tragic 82.3% |
| Hispanics or Latinos | 0.0 /100 | #312 | Tragic 82.2% |
| Yaqui | 0.0 /100 | #313 | Tragic 82.2% |