Tongan vs Native/Alaskan College, 1 year or more
COMPARE
Tongan
Native/Alaskan
College, 1 year or more
College, 1 year or more Comparison
Tongans
Natives/Alaskans
57.8%
COLLEGE, 1 YEAR OR MORE
11.6/ 100
METRIC RATING
215th/ 347
METRIC RANK
50.2%
COLLEGE, 1 YEAR OR MORE
0.0/ 100
METRIC RATING
330th/ 347
METRIC RANK
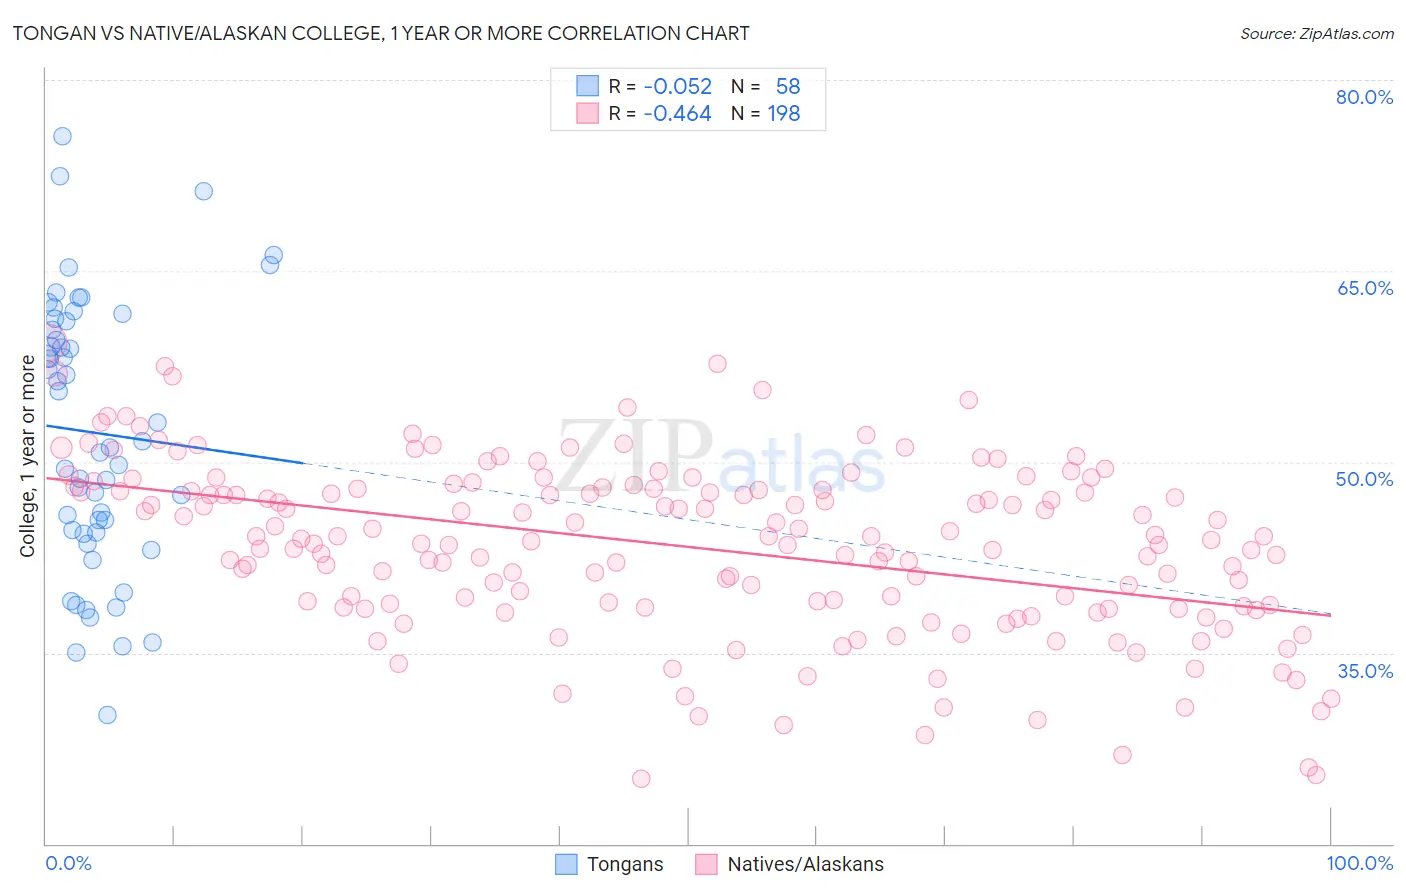
Tongan vs Native/Alaskan College, 1 year or more Correlation Chart
The statistical analysis conducted on geographies consisting of 102,908,759 people shows a slight negative correlation between the proportion of Tongans and percentage of population with at least college, 1 year or more education in the United States with a correlation coefficient (R) of -0.052 and weighted average of 57.8%. Similarly, the statistical analysis conducted on geographies consisting of 513,066,104 people shows a moderate negative correlation between the proportion of Natives/Alaskans and percentage of population with at least college, 1 year or more education in the United States with a correlation coefficient (R) of -0.464 and weighted average of 50.2%, a difference of 15.2%.
College, 1 year or more Correlation Summary
| Measurement | Tongan | Native/Alaskan |
| Minimum | 30.2% | 25.1% |
| Maximum | 75.6% | 59.4% |
| Range | 45.4% | 34.4% |
| Mean | 52.3% | 43.3% |
| Median | 51.4% | 43.9% |
| Interquartile 25% (IQ1) | 44.5% | 38.6% |
| Interquartile 75% (IQ3) | 61.1% | 47.9% |
| Interquartile Range (IQR) | 16.6% | 9.2% |
| Standard Deviation (Sample) | 10.5% | 6.8% |
| Standard Deviation (Population) | 10.5% | 6.8% |
Similar Demographics by College, 1 year or more
Demographics Similar to Tongans by College, 1 year or more
In terms of college, 1 year or more, the demographic groups most similar to Tongans are Immigrants from Colombia (57.8%, a difference of 0.0%), Immigrants from Senegal (57.8%, a difference of 0.040%), French Canadian (57.8%, a difference of 0.040%), Immigrants from Peru (57.7%, a difference of 0.13%), and Immigrants from Nigeria (57.9%, a difference of 0.21%).
| Demographics | Rating | Rank | College, 1 year or more |
| Immigrants | Uruguay | 15.2 /100 | #208 | Poor 58.1% |
| Immigrants | Middle Africa | 14.0 /100 | #209 | Poor 58.0% |
| Tsimshian | 13.5 /100 | #210 | Poor 57.9% |
| Immigrants | Nigeria | 13.3 /100 | #211 | Poor 57.9% |
| Immigrants | Senegal | 11.8 /100 | #212 | Poor 57.8% |
| French Canadians | 11.8 /100 | #213 | Poor 57.8% |
| Immigrants | Colombia | 11.6 /100 | #214 | Poor 57.8% |
| Tongans | 11.6 /100 | #215 | Poor 57.8% |
| Immigrants | Peru | 10.6 /100 | #216 | Poor 57.7% |
| Immigrants | Panama | 9.1 /100 | #217 | Tragic 57.6% |
| Native Hawaiians | 9.0 /100 | #218 | Tragic 57.6% |
| Whites/Caucasians | 8.7 /100 | #219 | Tragic 57.6% |
| Immigrants | Costa Rica | 8.0 /100 | #220 | Tragic 57.5% |
| Immigrants | Ghana | 7.7 /100 | #221 | Tragic 57.4% |
| Sub-Saharan Africans | 6.1 /100 | #222 | Tragic 57.3% |
Demographics Similar to Natives/Alaskans by College, 1 year or more
In terms of college, 1 year or more, the demographic groups most similar to Natives/Alaskans are Cape Verdean (50.3%, a difference of 0.22%), Immigrants from Yemen (50.0%, a difference of 0.35%), Dutch West Indian (50.5%, a difference of 0.62%), Menominee (50.6%, a difference of 0.74%), and Dominican (50.6%, a difference of 0.77%).
| Demographics | Rating | Rank | College, 1 year or more |
| Immigrants | Guatemala | 0.0 /100 | #323 | Tragic 50.7% |
| Immigrants | Cuba | 0.0 /100 | #324 | Tragic 50.7% |
| Immigrants | Latin America | 0.0 /100 | #325 | Tragic 50.7% |
| Dominicans | 0.0 /100 | #326 | Tragic 50.6% |
| Menominee | 0.0 /100 | #327 | Tragic 50.6% |
| Dutch West Indians | 0.0 /100 | #328 | Tragic 50.5% |
| Cape Verdeans | 0.0 /100 | #329 | Tragic 50.3% |
| Natives/Alaskans | 0.0 /100 | #330 | Tragic 50.2% |
| Immigrants | Yemen | 0.0 /100 | #331 | Tragic 50.0% |
| Mexicans | 0.0 /100 | #332 | Tragic 49.2% |
| Immigrants | Dominican Republic | 0.0 /100 | #333 | Tragic 49.1% |
| Lumbee | 0.0 /100 | #334 | Tragic 48.9% |
| Yuman | 0.0 /100 | #335 | Tragic 48.7% |
| Spanish American Indians | 0.0 /100 | #336 | Tragic 48.5% |
| Pennsylvania Germans | 0.0 /100 | #337 | Tragic 48.5% |