Tlingit-Haida vs Trinidadian and Tobagonian Unemployment Among Ages 16 to 19 years
COMPARE
Tlingit-Haida
Trinidadian and Tobagonian
Unemployment Among Ages 16 to 19 years
Unemployment Among Ages 16 to 19 years Comparison
Tlingit-Haida
Trinidadians and Tobagonians
23.5%
UNEMPLOYMENT AMONG AGES 16 TO 19 YEARS
0.0/ 100
METRIC RATING
329th/ 347
METRIC RANK
22.6%
UNEMPLOYMENT AMONG AGES 16 TO 19 YEARS
0.0/ 100
METRIC RATING
325th/ 347
METRIC RANK
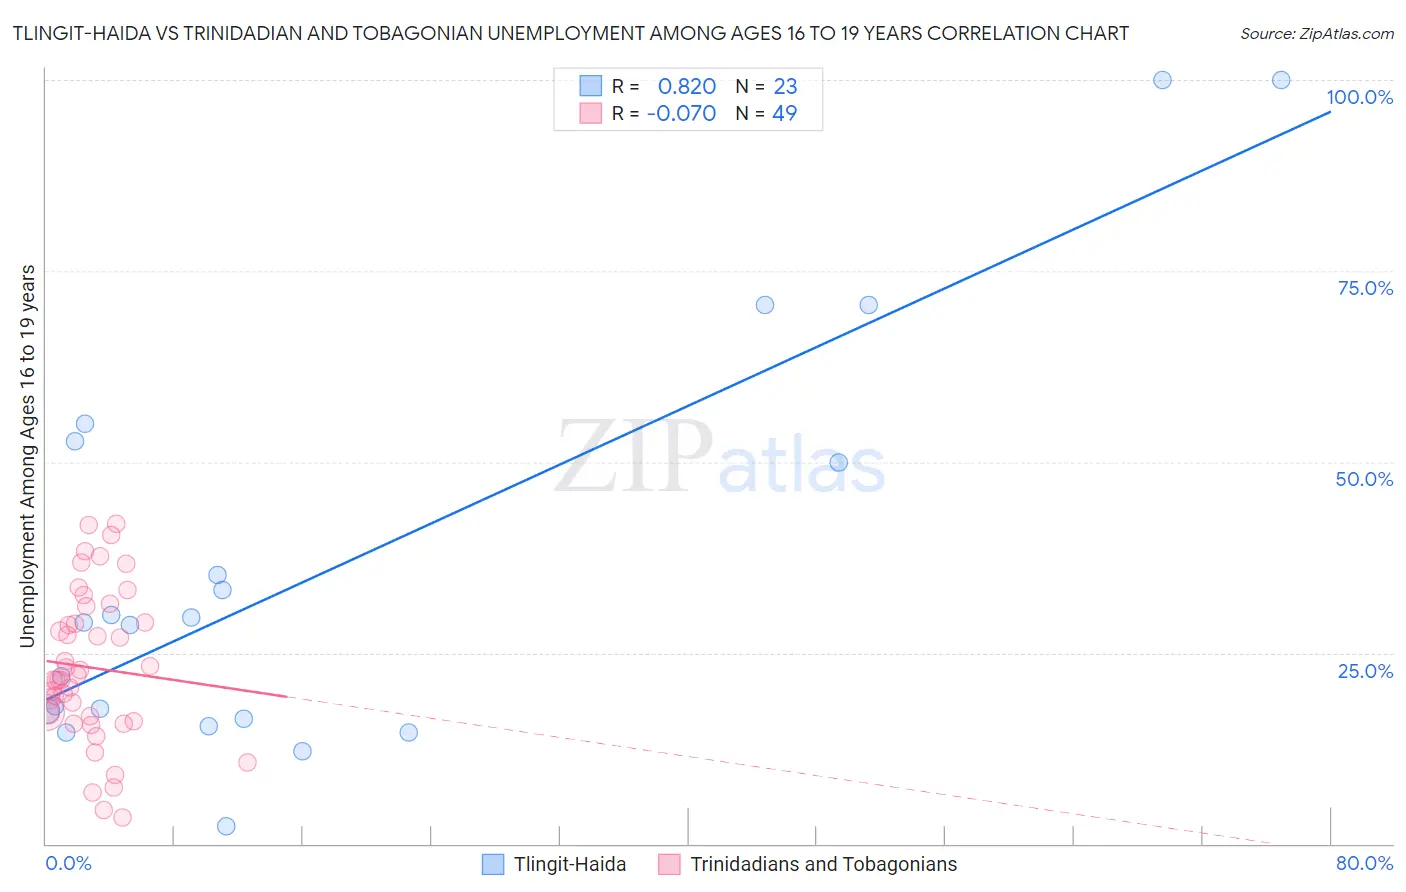
Tlingit-Haida vs Trinidadian and Tobagonian Unemployment Among Ages 16 to 19 years Correlation Chart
The statistical analysis conducted on geographies consisting of 59,818,277 people shows a very strong positive correlation between the proportion of Tlingit-Haida and unemployment rate among population between the ages 16 and 19 in the United States with a correlation coefficient (R) of 0.820 and weighted average of 23.5%. Similarly, the statistical analysis conducted on geographies consisting of 213,358,887 people shows a slight negative correlation between the proportion of Trinidadians and Tobagonians and unemployment rate among population between the ages 16 and 19 in the United States with a correlation coefficient (R) of -0.070 and weighted average of 22.6%, a difference of 4.0%.
Unemployment Among Ages 16 to 19 years Correlation Summary
| Measurement | Tlingit-Haida | Trinidadian and Tobagonian |
| Minimum | 2.3% | 3.4% |
| Maximum | 100.0% | 41.9% |
| Range | 97.7% | 38.5% |
| Mean | 36.3% | 23.1% |
| Median | 28.9% | 21.5% |
| Interquartile 25% (IQ1) | 16.4% | 16.4% |
| Interquartile 75% (IQ3) | 52.6% | 30.0% |
| Interquartile Range (IQR) | 36.2% | 13.5% |
| Standard Deviation (Sample) | 27.2% | 9.8% |
| Standard Deviation (Population) | 26.6% | 9.7% |
Demographics Similar to Tlingit-Haida and Trinidadians and Tobagonians by Unemployment Among Ages 16 to 19 years
In terms of unemployment among ages 16 to 19 years, the demographic groups most similar to Tlingit-Haida are Dominican (23.6%, a difference of 0.44%), Immigrants from Dominican Republic (23.3%, a difference of 1.1%), Pima (23.1%, a difference of 1.7%), British West Indian (24.0%, a difference of 1.8%), and Immigrants from Trinidad and Tobago (23.1%, a difference of 2.0%). Similarly, the demographic groups most similar to Trinidadians and Tobagonians are Immigrants from Armenia (22.6%, a difference of 0.12%), Yakama (22.5%, a difference of 0.57%), Barbadian (22.5%, a difference of 0.79%), West Indian (22.4%, a difference of 0.93%), and Cheyenne (22.3%, a difference of 1.6%).
| Demographics | Rating | Rank | Unemployment Among Ages 16 to 19 years |
| Immigrants | Belize | 0.0 /100 | #317 | Tragic 22.2% |
| Immigrants | Jamaica | 0.0 /100 | #318 | Tragic 22.2% |
| Immigrants | West Indies | 0.0 /100 | #319 | Tragic 22.2% |
| Cheyenne | 0.0 /100 | #320 | Tragic 22.3% |
| West Indians | 0.0 /100 | #321 | Tragic 22.4% |
| Barbadians | 0.0 /100 | #322 | Tragic 22.5% |
| Yakama | 0.0 /100 | #323 | Tragic 22.5% |
| Immigrants | Armenia | 0.0 /100 | #324 | Tragic 22.6% |
| Trinidadians and Tobagonians | 0.0 /100 | #325 | Tragic 22.6% |
| Immigrants | Trinidad and Tobago | 0.0 /100 | #326 | Tragic 23.1% |
| Pima | 0.0 /100 | #327 | Tragic 23.1% |
| Immigrants | Dominican Republic | 0.0 /100 | #328 | Tragic 23.3% |
| Tlingit-Haida | 0.0 /100 | #329 | Tragic 23.5% |
| Dominicans | 0.0 /100 | #330 | Tragic 23.6% |
| British West Indians | 0.0 /100 | #331 | Tragic 24.0% |
| Immigrants | Barbados | 0.0 /100 | #332 | Tragic 24.0% |
| Paiute | 0.0 /100 | #333 | Tragic 24.4% |
| Guyanese | 0.0 /100 | #334 | Tragic 24.8% |
| Arapaho | 0.0 /100 | #335 | Tragic 25.2% |
| Kiowa | 0.0 /100 | #336 | Tragic 25.2% |
| Immigrants | Guyana | 0.0 /100 | #337 | Tragic 25.5% |