Thai vs Comanche College, 1 year or more
COMPARE
Thai
Comanche
College, 1 year or more
College, 1 year or more Comparison
Thais
Comanche
68.6%
COLLEGE, 1 YEAR OR MORE
100.0/ 100
METRIC RATING
8th/ 347
METRIC RANK
54.4%
COLLEGE, 1 YEAR OR MORE
0.2/ 100
METRIC RATING
272nd/ 347
METRIC RANK
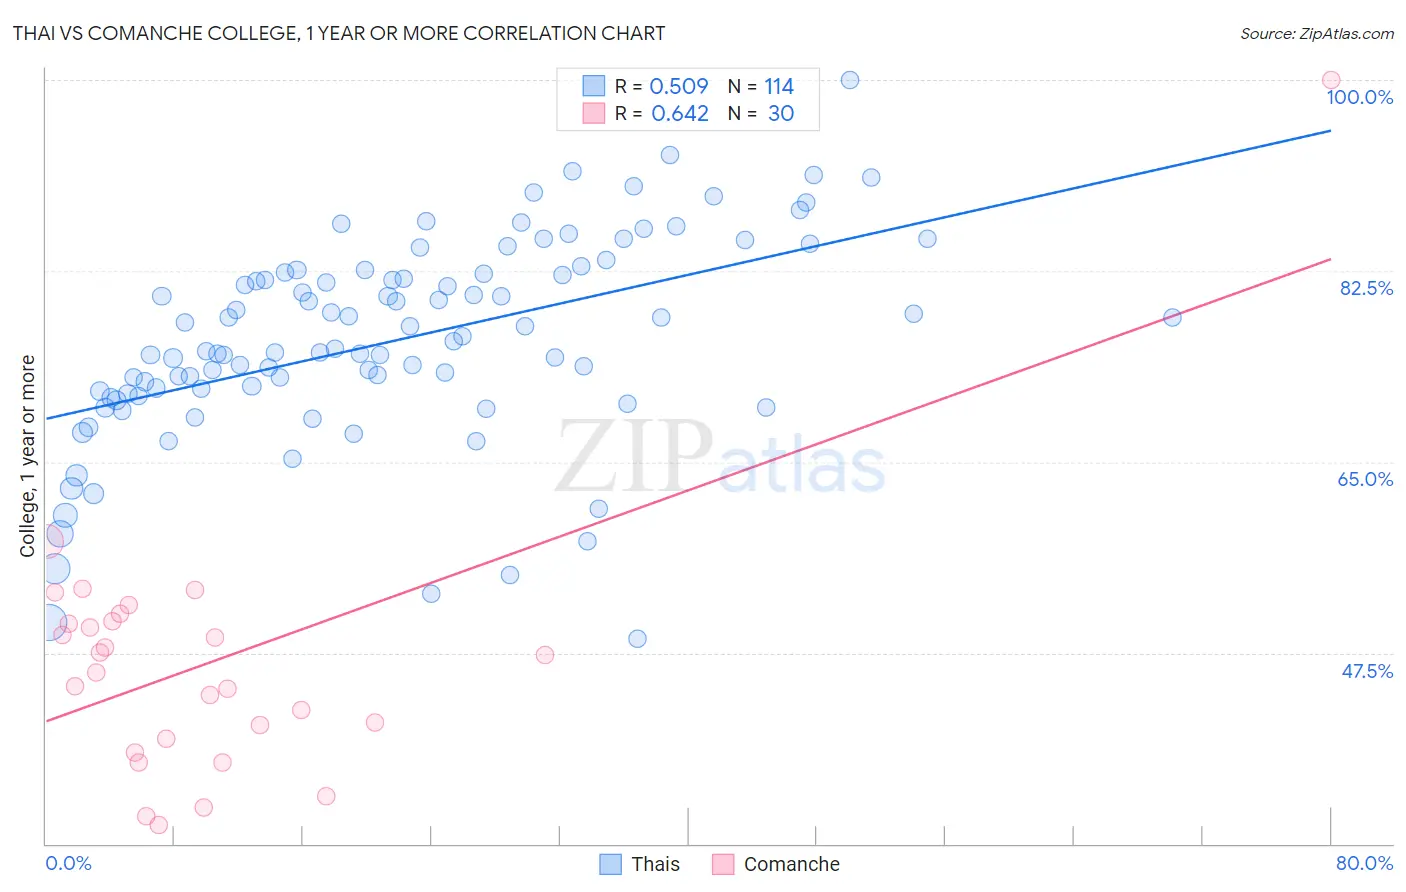
Thai vs Comanche College, 1 year or more Correlation Chart
The statistical analysis conducted on geographies consisting of 475,810,448 people shows a substantial positive correlation between the proportion of Thais and percentage of population with at least college, 1 year or more education in the United States with a correlation coefficient (R) of 0.509 and weighted average of 68.6%. Similarly, the statistical analysis conducted on geographies consisting of 109,786,512 people shows a significant positive correlation between the proportion of Comanche and percentage of population with at least college, 1 year or more education in the United States with a correlation coefficient (R) of 0.642 and weighted average of 54.4%, a difference of 26.0%.
College, 1 year or more Correlation Summary
| Measurement | Thai | Comanche |
| Minimum | 48.8% | 31.7% |
| Maximum | 100.0% | 100.0% |
| Range | 51.2% | 68.3% |
| Mean | 76.1% | 46.6% |
| Median | 75.8% | 46.5% |
| Interquartile 25% (IQ1) | 71.2% | 39.6% |
| Interquartile 75% (IQ3) | 82.3% | 50.4% |
| Interquartile Range (IQR) | 11.0% | 10.8% |
| Standard Deviation (Sample) | 9.4% | 12.2% |
| Standard Deviation (Population) | 9.3% | 12.0% |
Similar Demographics by College, 1 year or more
Demographics Similar to Thais by College, 1 year or more
In terms of college, 1 year or more, the demographic groups most similar to Thais are Okinawan (69.0%, a difference of 0.54%), Immigrants from Israel (67.8%, a difference of 1.2%), Immigrants from Iran (69.5%, a difference of 1.3%), Immigrants from Australia (67.7%, a difference of 1.4%), and Immigrants from Taiwan (69.6%, a difference of 1.5%).
| Demographics | Rating | Rank | College, 1 year or more |
| Filipinos | 100.0 /100 | #1 | Exceptional 71.0% |
| Immigrants | Singapore | 100.0 /100 | #2 | Exceptional 70.1% |
| Iranians | 100.0 /100 | #3 | Exceptional 70.0% |
| Immigrants | Taiwan | 100.0 /100 | #4 | Exceptional 69.6% |
| Immigrants | India | 100.0 /100 | #5 | Exceptional 69.6% |
| Immigrants | Iran | 100.0 /100 | #6 | Exceptional 69.5% |
| Okinawans | 100.0 /100 | #7 | Exceptional 69.0% |
| Thais | 100.0 /100 | #8 | Exceptional 68.6% |
| Immigrants | Israel | 100.0 /100 | #9 | Exceptional 67.8% |
| Immigrants | Australia | 100.0 /100 | #10 | Exceptional 67.7% |
| Immigrants | South Central Asia | 100.0 /100 | #11 | Exceptional 67.1% |
| Cypriots | 100.0 /100 | #12 | Exceptional 67.0% |
| Immigrants | Sweden | 100.0 /100 | #13 | Exceptional 66.8% |
| Burmese | 100.0 /100 | #14 | Exceptional 66.7% |
| Cambodians | 100.0 /100 | #15 | Exceptional 66.7% |
Demographics Similar to Comanche by College, 1 year or more
In terms of college, 1 year or more, the demographic groups most similar to Comanche are Immigrants from Grenada (54.4%, a difference of 0.040%), Bahamian (54.5%, a difference of 0.050%), Crow (54.5%, a difference of 0.070%), Belizean (54.4%, a difference of 0.080%), and Bangladeshi (54.5%, a difference of 0.10%).
| Demographics | Rating | Rank | College, 1 year or more |
| Immigrants | Laos | 0.2 /100 | #265 | Tragic 54.7% |
| Potawatomi | 0.2 /100 | #266 | Tragic 54.6% |
| Blackfeet | 0.2 /100 | #267 | Tragic 54.6% |
| British West Indians | 0.2 /100 | #268 | Tragic 54.5% |
| Bangladeshis | 0.2 /100 | #269 | Tragic 54.5% |
| Crow | 0.2 /100 | #270 | Tragic 54.5% |
| Bahamians | 0.2 /100 | #271 | Tragic 54.5% |
| Comanche | 0.2 /100 | #272 | Tragic 54.4% |
| Immigrants | Grenada | 0.2 /100 | #273 | Tragic 54.4% |
| Belizeans | 0.2 /100 | #274 | Tragic 54.4% |
| Americans | 0.2 /100 | #275 | Tragic 54.4% |
| Shoshone | 0.2 /100 | #276 | Tragic 54.3% |
| Ecuadorians | 0.2 /100 | #277 | Tragic 54.3% |
| Immigrants | Jamaica | 0.1 /100 | #278 | Tragic 54.2% |
| Arapaho | 0.1 /100 | #279 | Tragic 54.1% |