Thai vs Comanche Seniors Poverty Over the Age of 75
COMPARE
Thai
Comanche
Seniors Poverty Over the Age of 75
Seniors Poverty Over the Age of 75 Comparison
Thais
Comanche
10.9%
SENIORS POVERTY OVER THE AGE OF 75
99.4/ 100
METRIC RATING
40th/ 347
METRIC RANK
12.8%
SENIORS POVERTY OVER THE AGE OF 75
7.0/ 100
METRIC RATING
210th/ 347
METRIC RANK
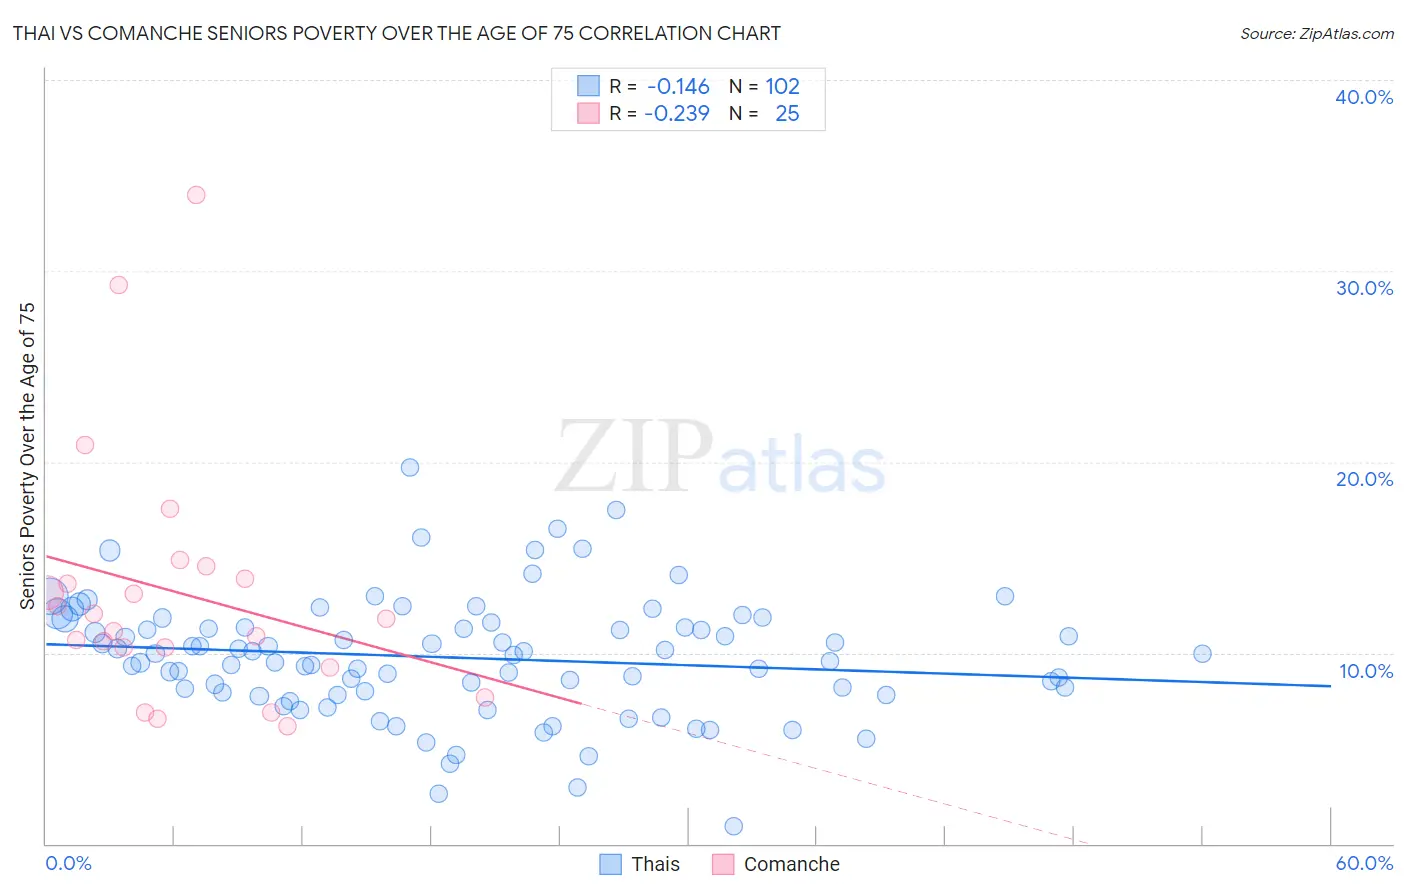
Thai vs Comanche Seniors Poverty Over the Age of 75 Correlation Chart
The statistical analysis conducted on geographies consisting of 468,192,905 people shows a poor negative correlation between the proportion of Thais and poverty level among seniors over the age of 75 in the United States with a correlation coefficient (R) of -0.146 and weighted average of 10.9%. Similarly, the statistical analysis conducted on geographies consisting of 109,150,338 people shows a weak negative correlation between the proportion of Comanche and poverty level among seniors over the age of 75 in the United States with a correlation coefficient (R) of -0.239 and weighted average of 12.8%, a difference of 17.4%.
Seniors Poverty Over the Age of 75 Correlation Summary
| Measurement | Thai | Comanche |
| Minimum | 0.92% | 6.1% |
| Maximum | 19.7% | 34.0% |
| Range | 18.8% | 27.9% |
| Mean | 9.7% | 13.1% |
| Median | 9.9% | 11.8% |
| Interquartile 25% (IQ1) | 7.9% | 9.7% |
| Interquartile 75% (IQ3) | 11.3% | 14.2% |
| Interquartile Range (IQR) | 3.4% | 4.5% |
| Standard Deviation (Sample) | 3.1% | 6.6% |
| Standard Deviation (Population) | 3.1% | 6.4% |
Similar Demographics by Seniors Poverty Over the Age of 75
Demographics Similar to Thais by Seniors Poverty Over the Age of 75
In terms of seniors poverty over the age of 75, the demographic groups most similar to Thais are Czechoslovakian (10.9%, a difference of 0.22%), Immigrants from Lithuania (11.0%, a difference of 0.49%), Austrian (11.0%, a difference of 0.76%), Celtic (11.0%, a difference of 0.81%), and Finnish (10.8%, a difference of 0.84%).
| Demographics | Rating | Rank | Seniors Poverty Over the Age of 75 |
| Puget Sound Salish | 99.7 /100 | #33 | Exceptional 10.8% |
| Italians | 99.7 /100 | #34 | Exceptional 10.8% |
| Luxembourgers | 99.6 /100 | #35 | Exceptional 10.8% |
| Scotch-Irish | 99.6 /100 | #36 | Exceptional 10.8% |
| Latvians | 99.6 /100 | #37 | Exceptional 10.8% |
| Finns | 99.6 /100 | #38 | Exceptional 10.8% |
| Czechoslovakians | 99.4 /100 | #39 | Exceptional 10.9% |
| Thais | 99.4 /100 | #40 | Exceptional 10.9% |
| Immigrants | Lithuania | 99.2 /100 | #41 | Exceptional 11.0% |
| Austrians | 99.1 /100 | #42 | Exceptional 11.0% |
| Celtics | 99.1 /100 | #43 | Exceptional 11.0% |
| Belgians | 99.1 /100 | #44 | Exceptional 11.0% |
| Carpatho Rusyns | 99.0 /100 | #45 | Exceptional 11.1% |
| Greeks | 99.0 /100 | #46 | Exceptional 11.1% |
| Hawaiians | 98.8 /100 | #47 | Exceptional 11.1% |
Demographics Similar to Comanche by Seniors Poverty Over the Age of 75
In terms of seniors poverty over the age of 75, the demographic groups most similar to Comanche are Brazilian (12.8%, a difference of 0.020%), Immigrants from Liberia (12.8%, a difference of 0.10%), Immigrants from Hong Kong (12.8%, a difference of 0.15%), French American Indian (12.9%, a difference of 0.30%), and Immigrants from Africa (12.9%, a difference of 0.37%).
| Demographics | Rating | Rank | Seniors Poverty Over the Age of 75 |
| Immigrants | Southern Europe | 10.7 /100 | #203 | Poor 12.7% |
| Immigrants | Eritrea | 10.5 /100 | #204 | Poor 12.7% |
| Indians (Asian) | 9.7 /100 | #205 | Tragic 12.7% |
| Albanians | 9.6 /100 | #206 | Tragic 12.7% |
| Costa Ricans | 8.7 /100 | #207 | Tragic 12.8% |
| Immigrants | Eastern Asia | 8.4 /100 | #208 | Tragic 12.8% |
| Immigrants | Liberia | 7.3 /100 | #209 | Tragic 12.8% |
| Comanche | 7.0 /100 | #210 | Tragic 12.8% |
| Brazilians | 6.9 /100 | #211 | Tragic 12.8% |
| Immigrants | Hong Kong | 6.5 /100 | #212 | Tragic 12.8% |
| French American Indians | 6.1 /100 | #213 | Tragic 12.9% |
| Immigrants | Africa | 5.9 /100 | #214 | Tragic 12.9% |
| South American Indians | 5.5 /100 | #215 | Tragic 12.9% |
| Immigrants | Brazil | 5.2 /100 | #216 | Tragic 12.9% |
| Bermudans | 4.9 /100 | #217 | Tragic 12.9% |