Thai vs South African College, 1 year or more
COMPARE
Thai
South African
College, 1 year or more
College, 1 year or more Comparison
Thais
South Africans
68.6%
COLLEGE, 1 YEAR OR MORE
100.0/ 100
METRIC RATING
8th/ 347
METRIC RANK
64.1%
COLLEGE, 1 YEAR OR MORE
99.7/ 100
METRIC RATING
57th/ 347
METRIC RANK
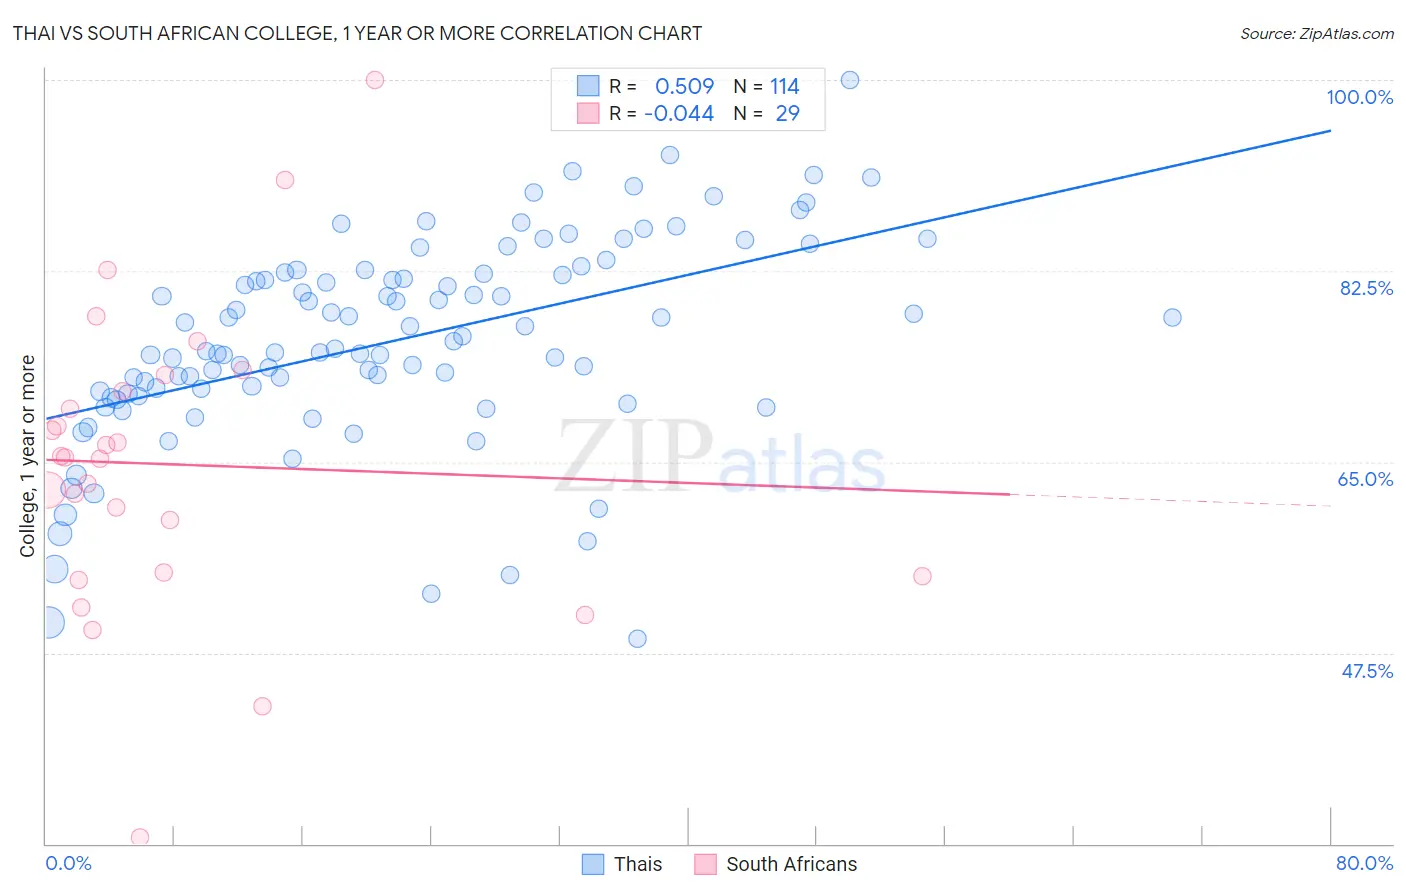
Thai vs South African College, 1 year or more Correlation Chart
The statistical analysis conducted on geographies consisting of 475,810,448 people shows a substantial positive correlation between the proportion of Thais and percentage of population with at least college, 1 year or more education in the United States with a correlation coefficient (R) of 0.509 and weighted average of 68.6%. Similarly, the statistical analysis conducted on geographies consisting of 182,603,987 people shows no correlation between the proportion of South Africans and percentage of population with at least college, 1 year or more education in the United States with a correlation coefficient (R) of -0.044 and weighted average of 64.1%, a difference of 7.0%.
College, 1 year or more Correlation Summary
| Measurement | Thai | South African |
| Minimum | 48.8% | 30.6% |
| Maximum | 100.0% | 100.0% |
| Range | 51.2% | 69.4% |
| Mean | 76.1% | 64.8% |
| Median | 75.8% | 65.4% |
| Interquartile 25% (IQ1) | 71.2% | 54.7% |
| Interquartile 75% (IQ3) | 82.3% | 72.3% |
| Interquartile Range (IQR) | 11.0% | 17.6% |
| Standard Deviation (Sample) | 9.4% | 13.9% |
| Standard Deviation (Population) | 9.3% | 13.7% |
Similar Demographics by College, 1 year or more
Demographics Similar to Thais by College, 1 year or more
In terms of college, 1 year or more, the demographic groups most similar to Thais are Okinawan (69.0%, a difference of 0.54%), Immigrants from Israel (67.8%, a difference of 1.2%), Immigrants from Iran (69.5%, a difference of 1.3%), Immigrants from Australia (67.7%, a difference of 1.4%), and Immigrants from Taiwan (69.6%, a difference of 1.5%).
| Demographics | Rating | Rank | College, 1 year or more |
| Filipinos | 100.0 /100 | #1 | Exceptional 71.0% |
| Immigrants | Singapore | 100.0 /100 | #2 | Exceptional 70.1% |
| Iranians | 100.0 /100 | #3 | Exceptional 70.0% |
| Immigrants | Taiwan | 100.0 /100 | #4 | Exceptional 69.6% |
| Immigrants | India | 100.0 /100 | #5 | Exceptional 69.6% |
| Immigrants | Iran | 100.0 /100 | #6 | Exceptional 69.5% |
| Okinawans | 100.0 /100 | #7 | Exceptional 69.0% |
| Thais | 100.0 /100 | #8 | Exceptional 68.6% |
| Immigrants | Israel | 100.0 /100 | #9 | Exceptional 67.8% |
| Immigrants | Australia | 100.0 /100 | #10 | Exceptional 67.7% |
| Immigrants | South Central Asia | 100.0 /100 | #11 | Exceptional 67.1% |
| Cypriots | 100.0 /100 | #12 | Exceptional 67.0% |
| Immigrants | Sweden | 100.0 /100 | #13 | Exceptional 66.8% |
| Burmese | 100.0 /100 | #14 | Exceptional 66.7% |
| Cambodians | 100.0 /100 | #15 | Exceptional 66.7% |
Demographics Similar to South Africans by College, 1 year or more
In terms of college, 1 year or more, the demographic groups most similar to South Africans are Immigrants from Czechoslovakia (64.1%, a difference of 0.010%), Immigrants from Belarus (64.1%, a difference of 0.040%), Immigrants from Asia (64.0%, a difference of 0.14%), Zimbabwean (64.2%, a difference of 0.16%), and Asian (64.2%, a difference of 0.19%).
| Demographics | Rating | Rank | College, 1 year or more |
| Immigrants | Austria | 99.8 /100 | #50 | Exceptional 64.4% |
| Immigrants | Malaysia | 99.8 /100 | #51 | Exceptional 64.3% |
| Immigrants | Netherlands | 99.8 /100 | #52 | Exceptional 64.2% |
| Asians | 99.8 /100 | #53 | Exceptional 64.2% |
| Zimbabweans | 99.8 /100 | #54 | Exceptional 64.2% |
| Immigrants | Belarus | 99.7 /100 | #55 | Exceptional 64.1% |
| Immigrants | Czechoslovakia | 99.7 /100 | #56 | Exceptional 64.1% |
| South Africans | 99.7 /100 | #57 | Exceptional 64.1% |
| Immigrants | Asia | 99.7 /100 | #58 | Exceptional 64.0% |
| Immigrants | Serbia | 99.6 /100 | #59 | Exceptional 63.8% |
| Immigrants | Kazakhstan | 99.5 /100 | #60 | Exceptional 63.6% |
| Bolivians | 99.5 /100 | #61 | Exceptional 63.5% |
| Immigrants | Indonesia | 99.5 /100 | #62 | Exceptional 63.5% |
| Immigrants | Scotland | 99.4 /100 | #63 | Exceptional 63.4% |
| Immigrants | Spain | 99.4 /100 | #64 | Exceptional 63.4% |