Thai vs Comanche 11th Grade
COMPARE
Thai
Comanche
11th Grade
11th Grade Comparison
Thais
Comanche
94.1%
11TH GRADE
99.9/ 100
METRIC RATING
40th/ 347
METRIC RANK
91.7%
11TH GRADE
2.6/ 100
METRIC RATING
238th/ 347
METRIC RANK
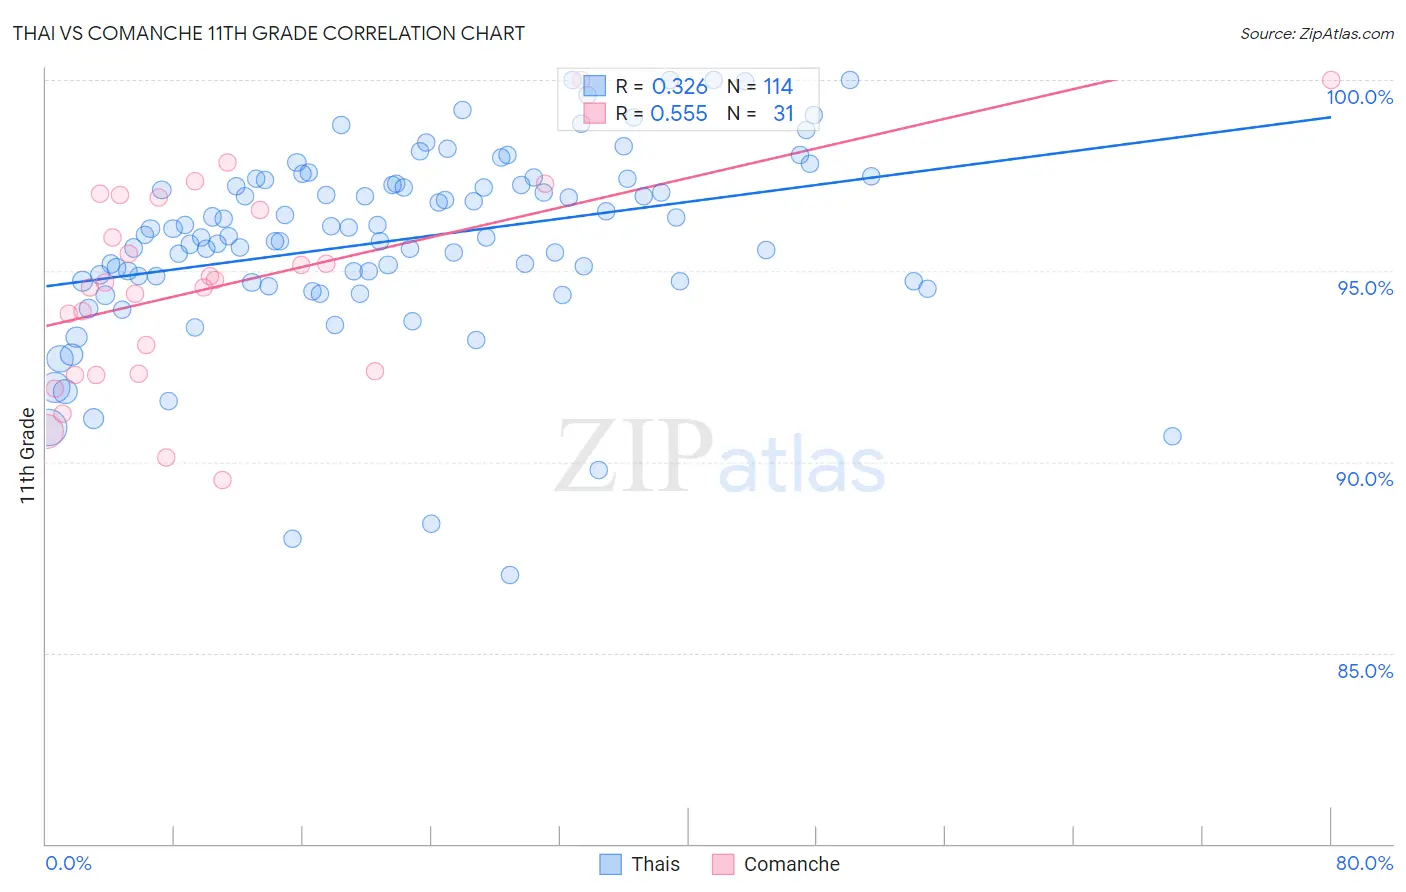
Thai vs Comanche 11th Grade Correlation Chart
The statistical analysis conducted on geographies consisting of 475,814,962 people shows a mild positive correlation between the proportion of Thais and percentage of population with at least 11th grade education in the United States with a correlation coefficient (R) of 0.326 and weighted average of 94.1%. Similarly, the statistical analysis conducted on geographies consisting of 109,786,530 people shows a substantial positive correlation between the proportion of Comanche and percentage of population with at least 11th grade education in the United States with a correlation coefficient (R) of 0.555 and weighted average of 91.7%, a difference of 2.7%.
11th Grade Correlation Summary
| Measurement | Thai | Comanche |
| Minimum | 87.0% | 89.5% |
| Maximum | 100.0% | 100.0% |
| Range | 13.0% | 10.5% |
| Mean | 95.8% | 94.6% |
| Median | 95.9% | 94.7% |
| Interquartile 25% (IQ1) | 94.7% | 92.3% |
| Interquartile 75% (IQ3) | 97.3% | 96.9% |
| Interquartile Range (IQR) | 2.6% | 4.6% |
| Standard Deviation (Sample) | 2.5% | 2.6% |
| Standard Deviation (Population) | 2.5% | 2.6% |
Similar Demographics by 11th Grade
Demographics Similar to Thais by 11th Grade
In terms of 11th grade, the demographic groups most similar to Thais are Immigrants from Lithuania (94.1%, a difference of 0.0%), Cypriot (94.1%, a difference of 0.010%), Immigrants from Austria (94.1%, a difference of 0.020%), Greek (94.1%, a difference of 0.020%), and Immigrants from Ireland (94.1%, a difference of 0.030%).
| Demographics | Rating | Rank | 11th Grade |
| British | 99.9 /100 | #33 | Exceptional 94.2% |
| Immigrants | Scotland | 99.9 /100 | #34 | Exceptional 94.2% |
| Immigrants | Singapore | 99.9 /100 | #35 | Exceptional 94.2% |
| Immigrants | Northern Europe | 99.9 /100 | #36 | Exceptional 94.2% |
| Northern Europeans | 99.9 /100 | #37 | Exceptional 94.2% |
| Hungarians | 99.9 /100 | #38 | Exceptional 94.2% |
| Immigrants | Lithuania | 99.9 /100 | #39 | Exceptional 94.1% |
| Thais | 99.9 /100 | #40 | Exceptional 94.1% |
| Cypriots | 99.9 /100 | #41 | Exceptional 94.1% |
| Immigrants | Austria | 99.9 /100 | #42 | Exceptional 94.1% |
| Greeks | 99.9 /100 | #43 | Exceptional 94.1% |
| Immigrants | Ireland | 99.9 /100 | #44 | Exceptional 94.1% |
| Australians | 99.9 /100 | #45 | Exceptional 94.1% |
| Serbians | 99.9 /100 | #46 | Exceptional 94.1% |
| Filipinos | 99.9 /100 | #47 | Exceptional 94.1% |
Demographics Similar to Comanche by 11th Grade
In terms of 11th grade, the demographic groups most similar to Comanche are Hopi (91.7%, a difference of 0.0%), Colombian (91.7%, a difference of 0.020%), Immigrants from Bolivia (91.7%, a difference of 0.020%), Armenian (91.7%, a difference of 0.030%), and Subsaharan African (91.7%, a difference of 0.030%).
| Demographics | Rating | Rank | 11th Grade |
| Choctaw | 3.7 /100 | #231 | Tragic 91.8% |
| Uruguayans | 3.5 /100 | #232 | Tragic 91.8% |
| Cheyenne | 3.3 /100 | #233 | Tragic 91.8% |
| Armenians | 2.9 /100 | #234 | Tragic 91.7% |
| Sub-Saharan Africans | 2.9 /100 | #235 | Tragic 91.7% |
| Colombians | 2.8 /100 | #236 | Tragic 91.7% |
| Immigrants | Bolivia | 2.8 /100 | #237 | Tragic 91.7% |
| Comanche | 2.6 /100 | #238 | Tragic 91.7% |
| Hopi | 2.5 /100 | #239 | Tragic 91.7% |
| South Americans | 2.0 /100 | #240 | Tragic 91.6% |
| Bahamians | 1.8 /100 | #241 | Tragic 91.6% |
| Immigrants | Middle Africa | 1.6 /100 | #242 | Tragic 91.6% |
| Immigrants | Thailand | 1.4 /100 | #243 | Tragic 91.6% |
| Senegalese | 1.4 /100 | #244 | Tragic 91.6% |
| Africans | 1.3 /100 | #245 | Tragic 91.5% |