Thai vs Comanche Ambulatory Disability
COMPARE
Thai
Comanche
Ambulatory Disability
Ambulatory Disability Comparison
Thais
Comanche
4.9%
AMBULATORY DISABILITY
100.0/ 100
METRIC RATING
3rd/ 347
METRIC RANK
7.5%
AMBULATORY DISABILITY
0.0/ 100
METRIC RATING
325th/ 347
METRIC RANK
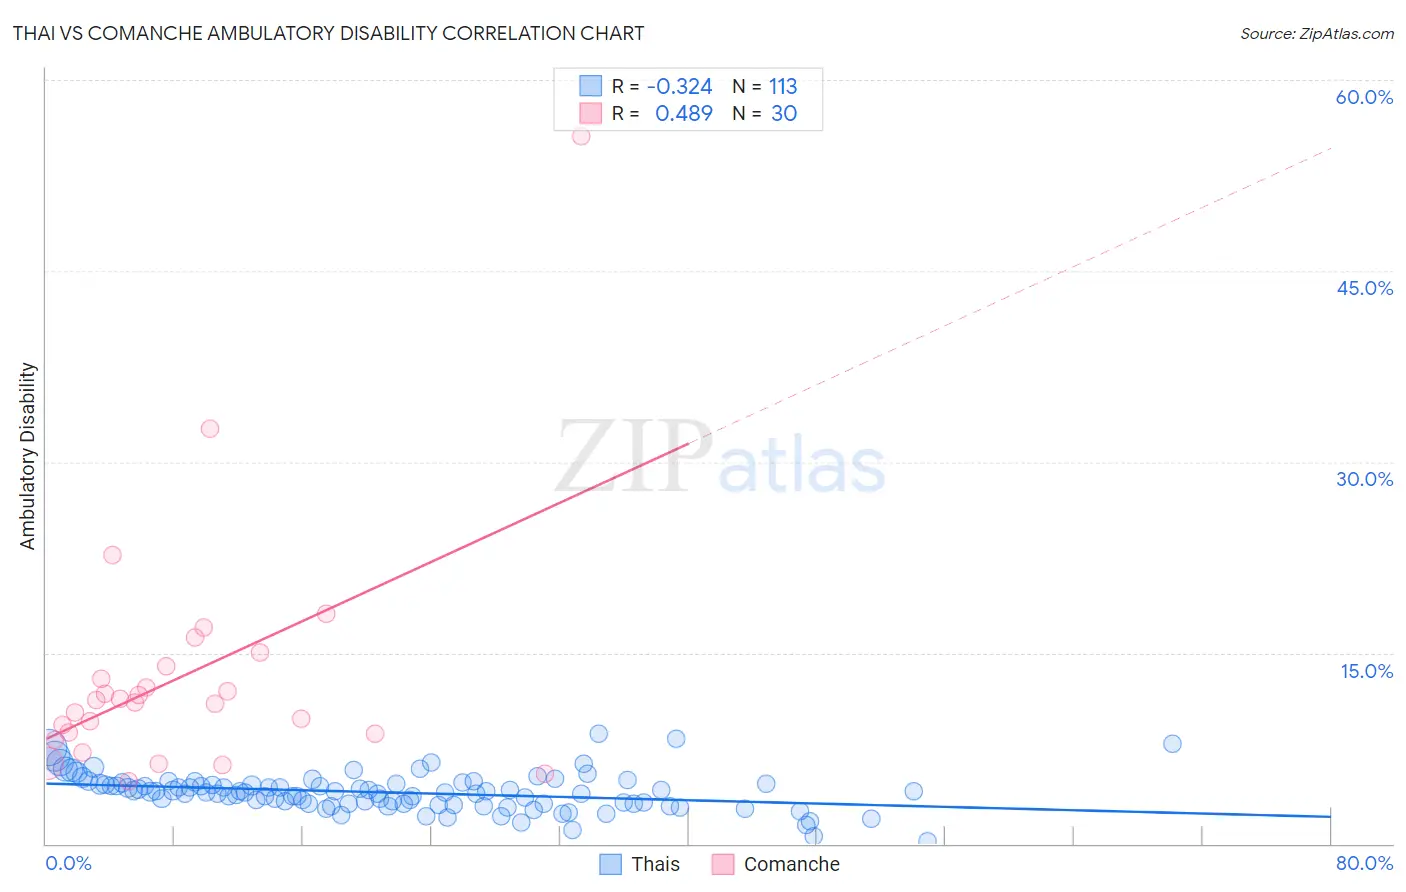
Thai vs Comanche Ambulatory Disability Correlation Chart
The statistical analysis conducted on geographies consisting of 475,631,146 people shows a mild negative correlation between the proportion of Thais and percentage of population with ambulatory disability in the United States with a correlation coefficient (R) of -0.324 and weighted average of 4.9%. Similarly, the statistical analysis conducted on geographies consisting of 109,774,668 people shows a moderate positive correlation between the proportion of Comanche and percentage of population with ambulatory disability in the United States with a correlation coefficient (R) of 0.489 and weighted average of 7.5%, a difference of 52.6%.
Ambulatory Disability Correlation Summary
| Measurement | Thai | Comanche |
| Minimum | 0.18% | 4.9% |
| Maximum | 8.6% | 55.6% |
| Range | 8.4% | 50.6% |
| Mean | 4.0% | 13.3% |
| Median | 4.1% | 11.2% |
| Interquartile 25% (IQ1) | 3.1% | 8.6% |
| Interquartile 75% (IQ3) | 4.7% | 13.9% |
| Interquartile Range (IQR) | 1.5% | 5.3% |
| Standard Deviation (Sample) | 1.4% | 9.7% |
| Standard Deviation (Population) | 1.4% | 9.6% |
Similar Demographics by Ambulatory Disability
Demographics Similar to Thais by Ambulatory Disability
In terms of ambulatory disability, the demographic groups most similar to Thais are Immigrants from Taiwan (4.9%, a difference of 0.24%), Filipino (4.9%, a difference of 1.2%), Immigrants from Singapore (5.0%, a difference of 1.6%), Immigrants from Bolivia (5.0%, a difference of 2.3%), and Bolivian (5.1%, a difference of 2.7%).
| Demographics | Rating | Rank | Ambulatory Disability |
| Immigrants | India | 100.0 /100 | #1 | Exceptional 4.8% |
| Filipinos | 100.0 /100 | #2 | Exceptional 4.9% |
| Thais | 100.0 /100 | #3 | Exceptional 4.9% |
| Immigrants | Taiwan | 100.0 /100 | #4 | Exceptional 4.9% |
| Immigrants | Singapore | 100.0 /100 | #5 | Exceptional 5.0% |
| Immigrants | Bolivia | 100.0 /100 | #6 | Exceptional 5.0% |
| Bolivians | 100.0 /100 | #7 | Exceptional 5.1% |
| Immigrants | South Central Asia | 100.0 /100 | #8 | Exceptional 5.1% |
| Iranians | 100.0 /100 | #9 | Exceptional 5.1% |
| Yup'ik | 100.0 /100 | #10 | Exceptional 5.2% |
| Immigrants | Korea | 100.0 /100 | #11 | Exceptional 5.2% |
| Okinawans | 100.0 /100 | #12 | Exceptional 5.3% |
| Burmese | 100.0 /100 | #13 | Exceptional 5.3% |
| Immigrants | Eastern Asia | 100.0 /100 | #14 | Exceptional 5.3% |
| Immigrants | China | 100.0 /100 | #15 | Exceptional 5.3% |
Demographics Similar to Comanche by Ambulatory Disability
In terms of ambulatory disability, the demographic groups most similar to Comanche are Navajo (7.5%, a difference of 0.070%), Black/African American (7.5%, a difference of 0.11%), Native/Alaskan (7.5%, a difference of 0.12%), Hopi (7.6%, a difference of 1.1%), and Pueblo (7.6%, a difference of 1.1%).
| Demographics | Rating | Rank | Ambulatory Disability |
| Ottawa | 0.0 /100 | #318 | Tragic 7.2% |
| Dominicans | 0.0 /100 | #319 | Tragic 7.2% |
| Potawatomi | 0.0 /100 | #320 | Tragic 7.3% |
| Apache | 0.0 /100 | #321 | Tragic 7.4% |
| Osage | 0.0 /100 | #322 | Tragic 7.4% |
| Americans | 0.0 /100 | #323 | Tragic 7.4% |
| Navajo | 0.0 /100 | #324 | Tragic 7.5% |
| Comanche | 0.0 /100 | #325 | Tragic 7.5% |
| Blacks/African Americans | 0.0 /100 | #326 | Tragic 7.5% |
| Natives/Alaskans | 0.0 /100 | #327 | Tragic 7.5% |
| Hopi | 0.0 /100 | #328 | Tragic 7.6% |
| Pueblo | 0.0 /100 | #329 | Tragic 7.6% |
| Paiute | 0.0 /100 | #330 | Tragic 7.7% |
| Cajuns | 0.0 /100 | #331 | Tragic 7.8% |
| Menominee | 0.0 /100 | #332 | Tragic 7.8% |