Thai vs Puget Sound Salish College, 1 year or more
COMPARE
Thai
Puget Sound Salish
College, 1 year or more
College, 1 year or more Comparison
Thais
Puget Sound Salish
68.6%
COLLEGE, 1 YEAR OR MORE
100.0/ 100
METRIC RATING
8th/ 347
METRIC RANK
55.9%
COLLEGE, 1 YEAR OR MORE
1.1/ 100
METRIC RATING
239th/ 347
METRIC RANK
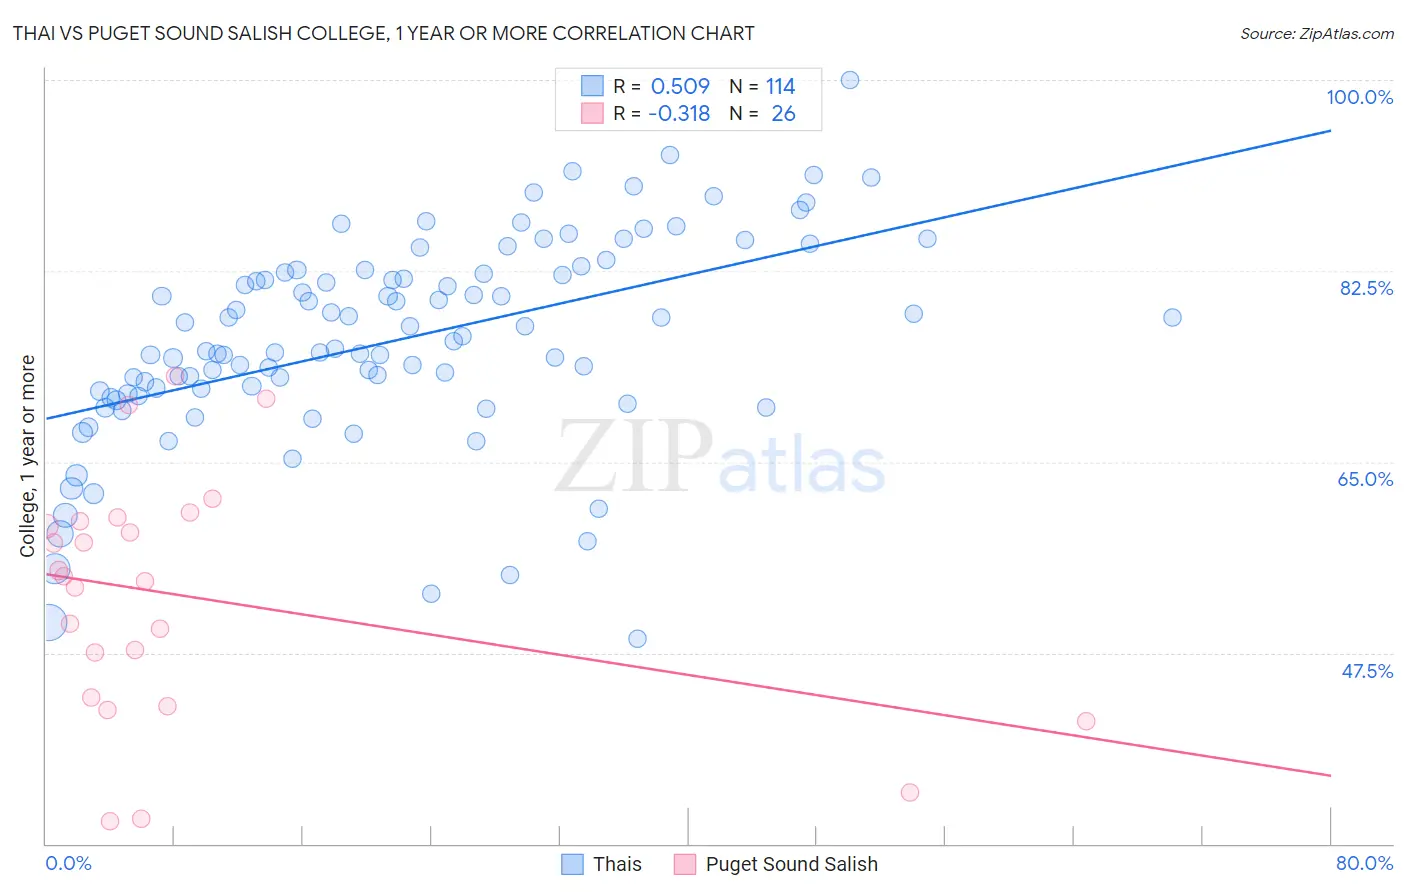
Thai vs Puget Sound Salish College, 1 year or more Correlation Chart
The statistical analysis conducted on geographies consisting of 475,810,448 people shows a substantial positive correlation between the proportion of Thais and percentage of population with at least college, 1 year or more education in the United States with a correlation coefficient (R) of 0.509 and weighted average of 68.6%. Similarly, the statistical analysis conducted on geographies consisting of 46,155,865 people shows a mild negative correlation between the proportion of Puget Sound Salish and percentage of population with at least college, 1 year or more education in the United States with a correlation coefficient (R) of -0.318 and weighted average of 55.9%, a difference of 22.7%.
College, 1 year or more Correlation Summary
| Measurement | Thai | Puget Sound Salish |
| Minimum | 48.8% | 32.1% |
| Maximum | 100.0% | 72.9% |
| Range | 51.2% | 40.8% |
| Mean | 76.1% | 52.7% |
| Median | 75.8% | 54.3% |
| Interquartile 25% (IQ1) | 71.2% | 43.4% |
| Interquartile 75% (IQ3) | 82.3% | 59.6% |
| Interquartile Range (IQR) | 11.0% | 16.2% |
| Standard Deviation (Sample) | 9.4% | 11.1% |
| Standard Deviation (Population) | 9.3% | 10.9% |
Similar Demographics by College, 1 year or more
Demographics Similar to Thais by College, 1 year or more
In terms of college, 1 year or more, the demographic groups most similar to Thais are Okinawan (69.0%, a difference of 0.54%), Immigrants from Israel (67.8%, a difference of 1.2%), Immigrants from Iran (69.5%, a difference of 1.3%), Immigrants from Australia (67.7%, a difference of 1.4%), and Immigrants from Taiwan (69.6%, a difference of 1.5%).
| Demographics | Rating | Rank | College, 1 year or more |
| Filipinos | 100.0 /100 | #1 | Exceptional 71.0% |
| Immigrants | Singapore | 100.0 /100 | #2 | Exceptional 70.1% |
| Iranians | 100.0 /100 | #3 | Exceptional 70.0% |
| Immigrants | Taiwan | 100.0 /100 | #4 | Exceptional 69.6% |
| Immigrants | India | 100.0 /100 | #5 | Exceptional 69.6% |
| Immigrants | Iran | 100.0 /100 | #6 | Exceptional 69.5% |
| Okinawans | 100.0 /100 | #7 | Exceptional 69.0% |
| Thais | 100.0 /100 | #8 | Exceptional 68.6% |
| Immigrants | Israel | 100.0 /100 | #9 | Exceptional 67.8% |
| Immigrants | Australia | 100.0 /100 | #10 | Exceptional 67.7% |
| Immigrants | South Central Asia | 100.0 /100 | #11 | Exceptional 67.1% |
| Cypriots | 100.0 /100 | #12 | Exceptional 67.0% |
| Immigrants | Sweden | 100.0 /100 | #13 | Exceptional 66.8% |
| Burmese | 100.0 /100 | #14 | Exceptional 66.7% |
| Cambodians | 100.0 /100 | #15 | Exceptional 66.7% |
Demographics Similar to Puget Sound Salish by College, 1 year or more
In terms of college, 1 year or more, the demographic groups most similar to Puget Sound Salish are Trinidadian and Tobagonian (55.8%, a difference of 0.090%), French American Indian (55.8%, a difference of 0.14%), Barbadian (56.0%, a difference of 0.20%), Marshallese (55.8%, a difference of 0.25%), and Osage (55.8%, a difference of 0.26%).
| Demographics | Rating | Rank | College, 1 year or more |
| Immigrants | Bangladesh | 2.6 /100 | #232 | Tragic 56.6% |
| Immigrants | Nonimmigrants | 2.5 /100 | #233 | Tragic 56.5% |
| Spanish Americans | 1.8 /100 | #234 | Tragic 56.3% |
| West Indians | 1.8 /100 | #235 | Tragic 56.3% |
| Iroquois | 1.7 /100 | #236 | Tragic 56.2% |
| Samoans | 1.6 /100 | #237 | Tragic 56.2% |
| Barbadians | 1.3 /100 | #238 | Tragic 56.0% |
| Puget Sound Salish | 1.1 /100 | #239 | Tragic 55.9% |
| Trinidadians and Tobagonians | 1.1 /100 | #240 | Tragic 55.8% |
| French American Indians | 1.0 /100 | #241 | Tragic 55.8% |
| Marshallese | 1.0 /100 | #242 | Tragic 55.8% |
| Osage | 1.0 /100 | #243 | Tragic 55.8% |
| Chippewa | 0.9 /100 | #244 | Tragic 55.7% |
| Immigrants | Liberia | 0.8 /100 | #245 | Tragic 55.7% |
| Malaysians | 0.8 /100 | #246 | Tragic 55.6% |