Immigrants from Ghana vs Comanche College, 1 year or more
COMPARE
Immigrants from Ghana
Comanche
College, 1 year or more
College, 1 year or more Comparison
Immigrants from Ghana
Comanche
57.4%
COLLEGE, 1 YEAR OR MORE
7.7/ 100
METRIC RATING
221st/ 347
METRIC RANK
54.4%
COLLEGE, 1 YEAR OR MORE
0.2/ 100
METRIC RATING
272nd/ 347
METRIC RANK
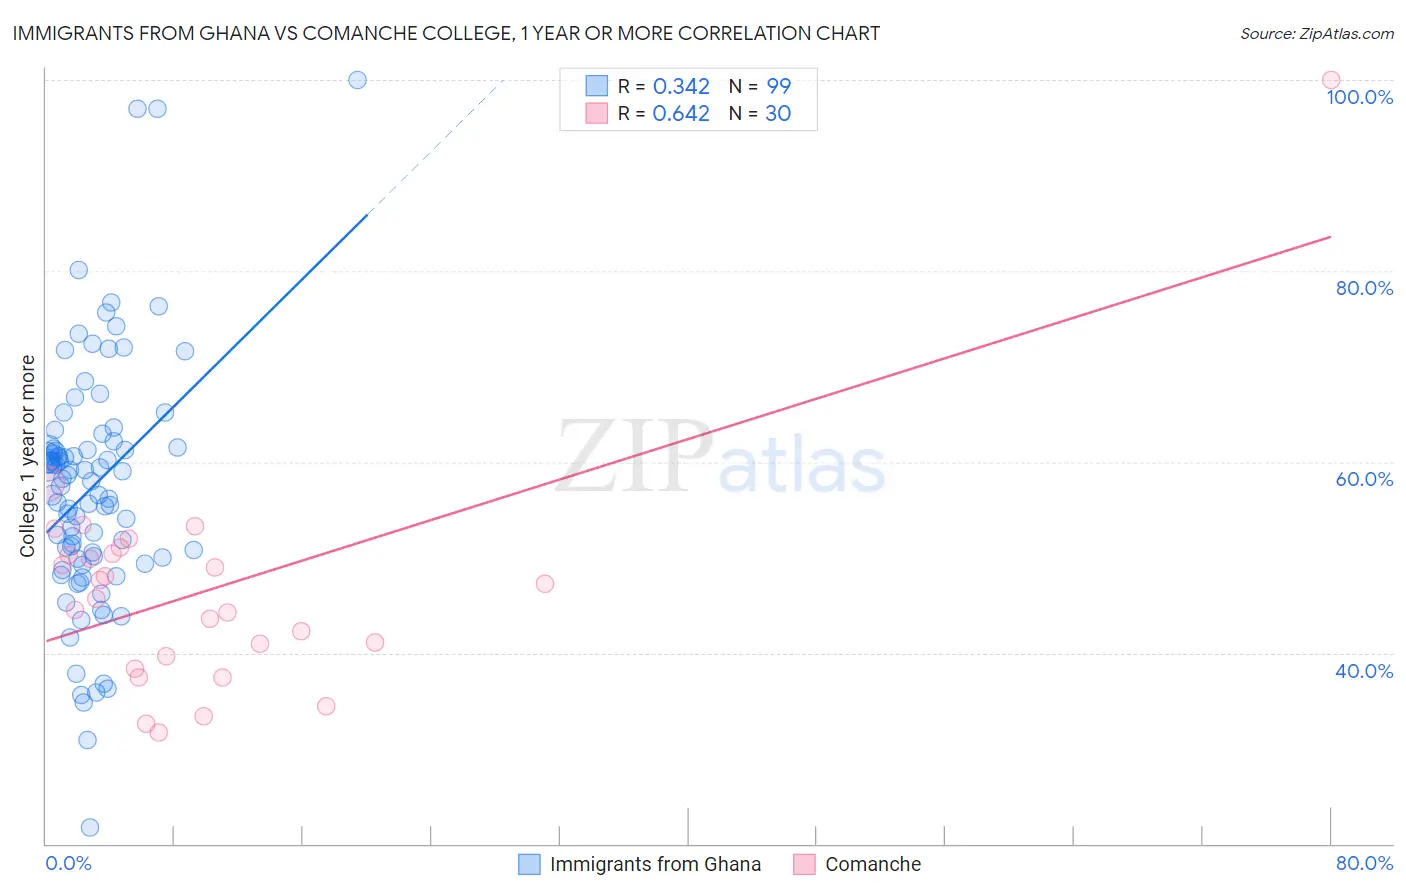
Immigrants from Ghana vs Comanche College, 1 year or more Correlation Chart
The statistical analysis conducted on geographies consisting of 199,951,982 people shows a mild positive correlation between the proportion of Immigrants from Ghana and percentage of population with at least college, 1 year or more education in the United States with a correlation coefficient (R) of 0.342 and weighted average of 57.4%. Similarly, the statistical analysis conducted on geographies consisting of 109,786,512 people shows a significant positive correlation between the proportion of Comanche and percentage of population with at least college, 1 year or more education in the United States with a correlation coefficient (R) of 0.642 and weighted average of 54.4%, a difference of 5.5%.
College, 1 year or more Correlation Summary
| Measurement | Immigrants from Ghana | Comanche |
| Minimum | 21.7% | 31.7% |
| Maximum | 100.0% | 100.0% |
| Range | 78.3% | 68.3% |
| Mean | 57.3% | 46.6% |
| Median | 58.2% | 46.5% |
| Interquartile 25% (IQ1) | 50.0% | 39.6% |
| Interquartile 75% (IQ3) | 61.5% | 50.4% |
| Interquartile Range (IQR) | 11.5% | 10.8% |
| Standard Deviation (Sample) | 12.8% | 12.2% |
| Standard Deviation (Population) | 12.7% | 12.0% |
Similar Demographics by College, 1 year or more
Demographics Similar to Immigrants from Ghana by College, 1 year or more
In terms of college, 1 year or more, the demographic groups most similar to Immigrants from Ghana are Immigrants from Costa Rica (57.5%, a difference of 0.070%), White/Caucasian (57.6%, a difference of 0.19%), Immigrants from Panama (57.6%, a difference of 0.25%), Native Hawaiian (57.6%, a difference of 0.25%), and Subsaharan African (57.3%, a difference of 0.34%).
| Demographics | Rating | Rank | College, 1 year or more |
| Immigrants | Colombia | 11.6 /100 | #214 | Poor 57.8% |
| Tongans | 11.6 /100 | #215 | Poor 57.8% |
| Immigrants | Peru | 10.6 /100 | #216 | Poor 57.7% |
| Immigrants | Panama | 9.1 /100 | #217 | Tragic 57.6% |
| Native Hawaiians | 9.0 /100 | #218 | Tragic 57.6% |
| Whites/Caucasians | 8.7 /100 | #219 | Tragic 57.6% |
| Immigrants | Costa Rica | 8.0 /100 | #220 | Tragic 57.5% |
| Immigrants | Ghana | 7.7 /100 | #221 | Tragic 57.4% |
| Sub-Saharan Africans | 6.1 /100 | #222 | Tragic 57.3% |
| Portuguese | 5.4 /100 | #223 | Tragic 57.2% |
| Hmong | 5.4 /100 | #224 | Tragic 57.2% |
| Vietnamese | 4.7 /100 | #225 | Tragic 57.0% |
| Immigrants | Western Africa | 4.6 /100 | #226 | Tragic 57.0% |
| Immigrants | Immigrants | 4.4 /100 | #227 | Tragic 57.0% |
| Immigrants | Fiji | 4.0 /100 | #228 | Tragic 56.9% |
Demographics Similar to Comanche by College, 1 year or more
In terms of college, 1 year or more, the demographic groups most similar to Comanche are Immigrants from Grenada (54.4%, a difference of 0.040%), Bahamian (54.5%, a difference of 0.050%), Crow (54.5%, a difference of 0.070%), Belizean (54.4%, a difference of 0.080%), and Bangladeshi (54.5%, a difference of 0.10%).
| Demographics | Rating | Rank | College, 1 year or more |
| Immigrants | Laos | 0.2 /100 | #265 | Tragic 54.7% |
| Potawatomi | 0.2 /100 | #266 | Tragic 54.6% |
| Blackfeet | 0.2 /100 | #267 | Tragic 54.6% |
| British West Indians | 0.2 /100 | #268 | Tragic 54.5% |
| Bangladeshis | 0.2 /100 | #269 | Tragic 54.5% |
| Crow | 0.2 /100 | #270 | Tragic 54.5% |
| Bahamians | 0.2 /100 | #271 | Tragic 54.5% |
| Comanche | 0.2 /100 | #272 | Tragic 54.4% |
| Immigrants | Grenada | 0.2 /100 | #273 | Tragic 54.4% |
| Belizeans | 0.2 /100 | #274 | Tragic 54.4% |
| Americans | 0.2 /100 | #275 | Tragic 54.4% |
| Shoshone | 0.2 /100 | #276 | Tragic 54.3% |
| Ecuadorians | 0.2 /100 | #277 | Tragic 54.3% |
| Immigrants | Jamaica | 0.1 /100 | #278 | Tragic 54.2% |
| Arapaho | 0.1 /100 | #279 | Tragic 54.1% |