Sudanese vs American Associate's Degree
COMPARE
Sudanese
American
Associate's Degree
Associate's Degree Comparison
Sudanese
Americans
47.1%
ASSOCIATE'S DEGREE
70.3/ 100
METRIC RATING
157th/ 347
METRIC RANK
40.8%
ASSOCIATE'S DEGREE
0.2/ 100
METRIC RATING
269th/ 347
METRIC RANK
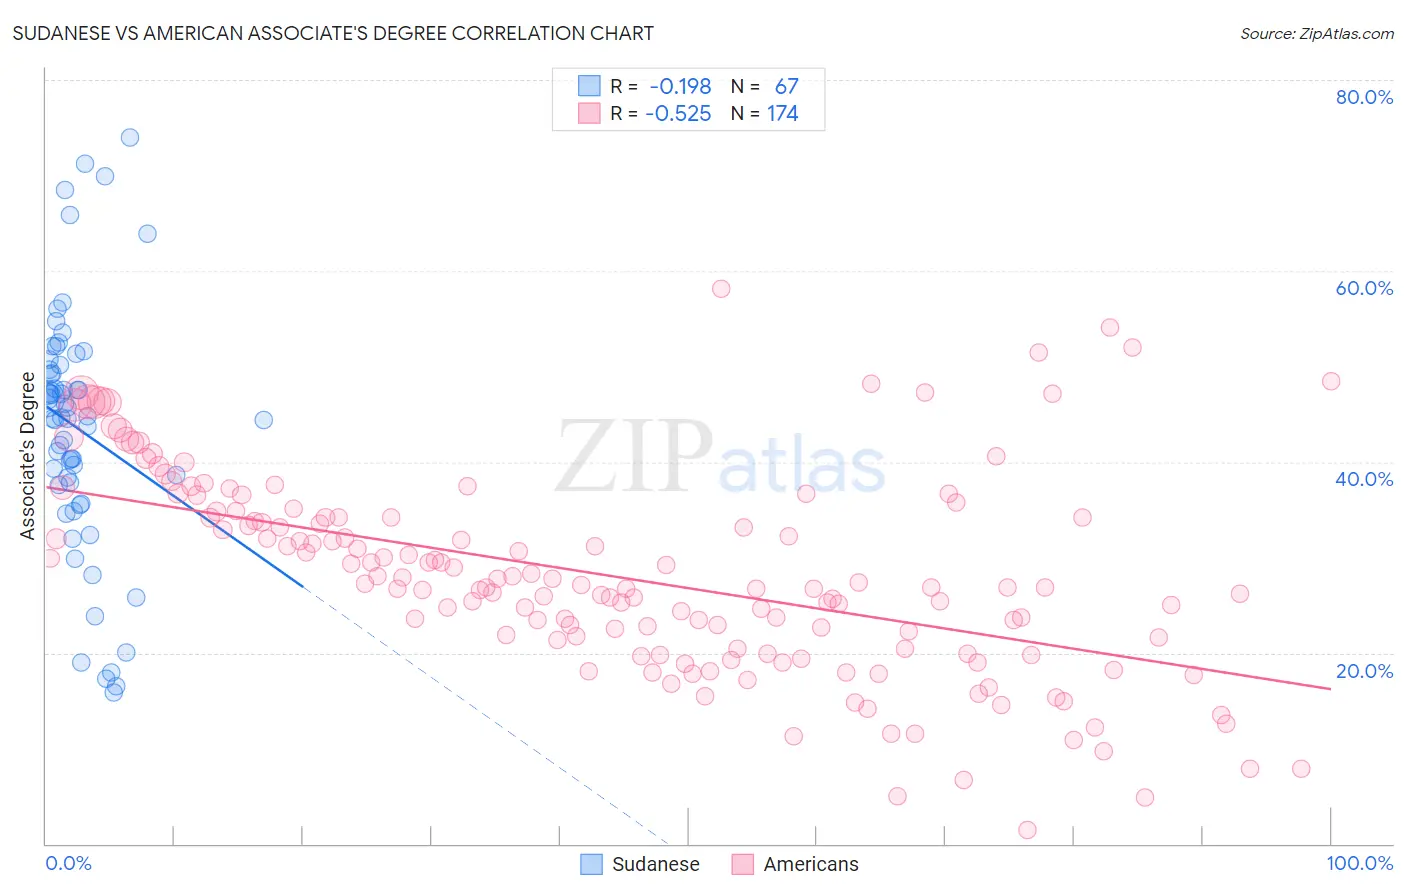
Sudanese vs American Associate's Degree Correlation Chart
The statistical analysis conducted on geographies consisting of 110,144,981 people shows a poor negative correlation between the proportion of Sudanese and percentage of population with at least associate's degree education in the United States with a correlation coefficient (R) of -0.198 and weighted average of 47.1%. Similarly, the statistical analysis conducted on geographies consisting of 581,858,249 people shows a substantial negative correlation between the proportion of Americans and percentage of population with at least associate's degree education in the United States with a correlation coefficient (R) of -0.525 and weighted average of 40.8%, a difference of 15.6%.
Associate's Degree Correlation Summary
| Measurement | Sudanese | American |
| Minimum | 15.8% | 1.4% |
| Maximum | 74.0% | 58.1% |
| Range | 58.2% | 56.7% |
| Mean | 43.5% | 28.0% |
| Median | 44.6% | 26.9% |
| Interquartile 25% (IQ1) | 37.6% | 20.4% |
| Interquartile 75% (IQ3) | 50.2% | 34.2% |
| Interquartile Range (IQR) | 12.6% | 13.8% |
| Standard Deviation (Sample) | 12.9% | 10.6% |
| Standard Deviation (Population) | 12.8% | 10.5% |
Similar Demographics by Associate's Degree
Demographics Similar to Sudanese by Associate's Degree
In terms of associate's degree, the demographic groups most similar to Sudanese are South American (47.1%, a difference of 0.020%), Kenyan (47.1%, a difference of 0.030%), Immigrants from Germany (47.1%, a difference of 0.040%), Immigrants from Poland (47.1%, a difference of 0.090%), and Immigrants from Kenya (47.2%, a difference of 0.16%).
| Demographics | Rating | Rank | Associate's Degree |
| Iraqis | 76.2 /100 | #150 | Good 47.4% |
| Immigrants | North Macedonia | 76.0 /100 | #151 | Good 47.4% |
| Immigrants | Afghanistan | 74.3 /100 | #152 | Good 47.3% |
| Czechs | 72.2 /100 | #153 | Good 47.2% |
| Immigrants | Kenya | 72.1 /100 | #154 | Good 47.2% |
| Kenyans | 70.6 /100 | #155 | Good 47.1% |
| South Americans | 70.5 /100 | #156 | Good 47.1% |
| Sudanese | 70.3 /100 | #157 | Good 47.1% |
| Immigrants | Germany | 69.7 /100 | #158 | Good 47.1% |
| Immigrants | Poland | 69.2 /100 | #159 | Good 47.1% |
| Scottish | 65.4 /100 | #160 | Good 46.9% |
| Scandinavians | 65.2 /100 | #161 | Good 46.9% |
| Immigrants | Africa | 63.2 /100 | #162 | Good 46.8% |
| Somalis | 62.5 /100 | #163 | Good 46.8% |
| Colombians | 62.4 /100 | #164 | Good 46.8% |
Demographics Similar to Americans by Associate's Degree
In terms of associate's degree, the demographic groups most similar to Americans are Chippewa (40.7%, a difference of 0.050%), Central American Indian (40.8%, a difference of 0.18%), Immigrants from Laos (40.7%, a difference of 0.23%), Belizean (40.6%, a difference of 0.30%), and Hawaiian (40.9%, a difference of 0.38%).
| Demographics | Rating | Rank | Associate's Degree |
| Bahamians | 0.4 /100 | #262 | Tragic 41.5% |
| Immigrants | Jamaica | 0.3 /100 | #263 | Tragic 41.5% |
| Osage | 0.3 /100 | #264 | Tragic 41.5% |
| Africans | 0.2 /100 | #265 | Tragic 41.1% |
| Samoans | 0.2 /100 | #266 | Tragic 41.1% |
| Hawaiians | 0.2 /100 | #267 | Tragic 40.9% |
| Central American Indians | 0.2 /100 | #268 | Tragic 40.8% |
| Americans | 0.2 /100 | #269 | Tragic 40.8% |
| Chippewa | 0.2 /100 | #270 | Tragic 40.7% |
| Immigrants | Laos | 0.1 /100 | #271 | Tragic 40.7% |
| Belizeans | 0.1 /100 | #272 | Tragic 40.6% |
| Puget Sound Salish | 0.1 /100 | #273 | Tragic 40.5% |
| Immigrants | Dominica | 0.1 /100 | #274 | Tragic 40.5% |
| Potawatomi | 0.1 /100 | #275 | Tragic 40.4% |
| Puerto Ricans | 0.1 /100 | #276 | Tragic 40.4% |