Chilean vs American Associate's Degree
COMPARE
Chilean
American
Associate's Degree
Associate's Degree Comparison
Chileans
Americans
49.4%
ASSOCIATE'S DEGREE
97.3/ 100
METRIC RATING
102nd/ 347
METRIC RANK
40.8%
ASSOCIATE'S DEGREE
0.2/ 100
METRIC RATING
269th/ 347
METRIC RANK
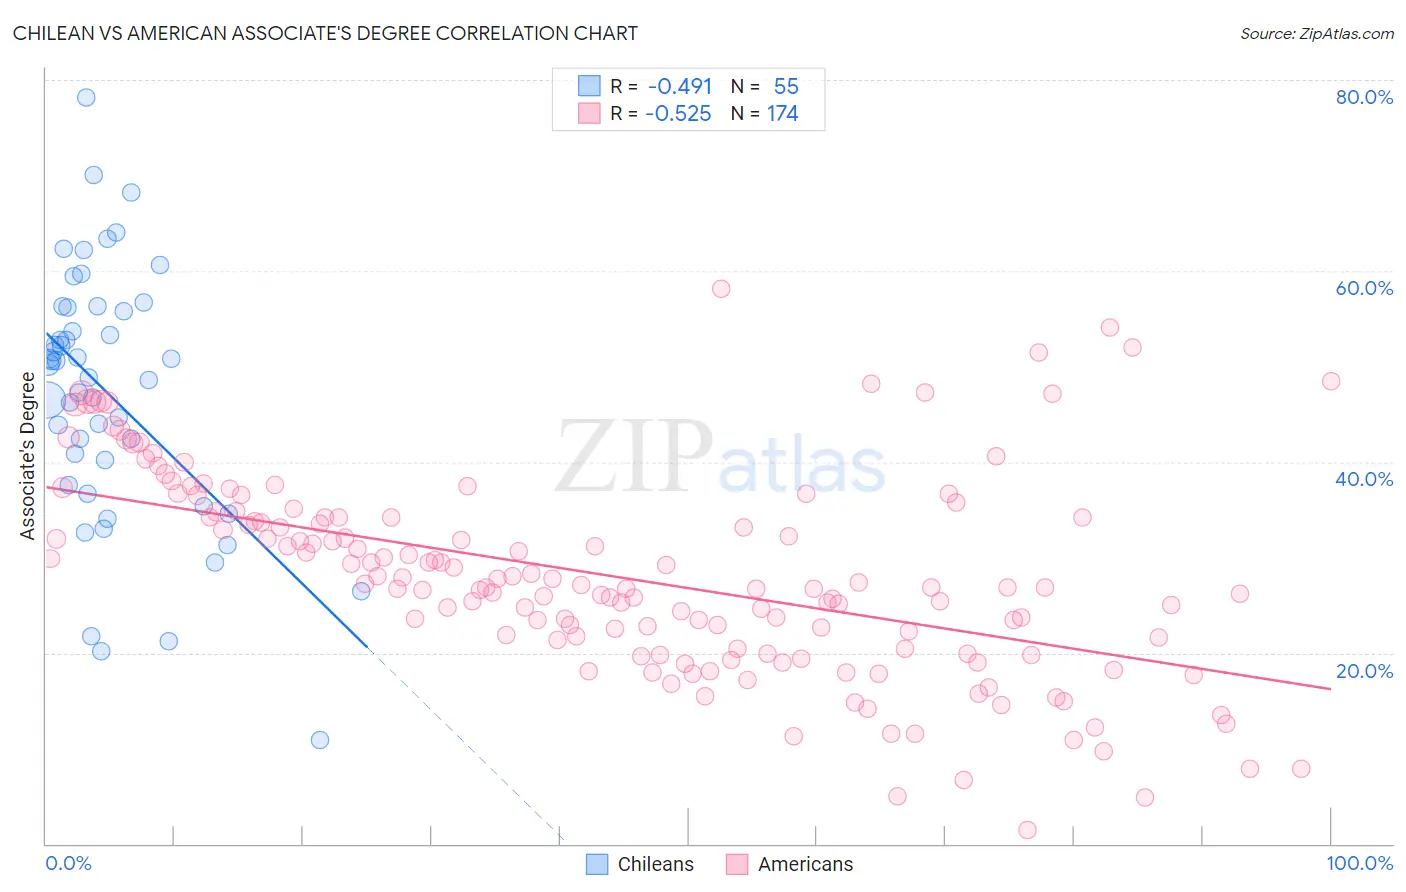
Chilean vs American Associate's Degree Correlation Chart
The statistical analysis conducted on geographies consisting of 256,684,279 people shows a moderate negative correlation between the proportion of Chileans and percentage of population with at least associate's degree education in the United States with a correlation coefficient (R) of -0.491 and weighted average of 49.4%. Similarly, the statistical analysis conducted on geographies consisting of 581,858,249 people shows a substantial negative correlation between the proportion of Americans and percentage of population with at least associate's degree education in the United States with a correlation coefficient (R) of -0.525 and weighted average of 40.8%, a difference of 21.3%.
Associate's Degree Correlation Summary
| Measurement | Chilean | American |
| Minimum | 10.9% | 1.4% |
| Maximum | 78.2% | 58.1% |
| Range | 67.3% | 56.7% |
| Mean | 47.1% | 28.0% |
| Median | 50.2% | 26.9% |
| Interquartile 25% (IQ1) | 37.6% | 20.4% |
| Interquartile 75% (IQ3) | 56.1% | 34.2% |
| Interquartile Range (IQR) | 18.5% | 13.8% |
| Standard Deviation (Sample) | 13.4% | 10.6% |
| Standard Deviation (Population) | 13.3% | 10.5% |
Similar Demographics by Associate's Degree
Demographics Similar to Chileans by Associate's Degree
In terms of associate's degree, the demographic groups most similar to Chileans are Northern European (49.5%, a difference of 0.030%), Ukrainian (49.4%, a difference of 0.11%), Venezuelan (49.4%, a difference of 0.17%), Immigrants from Nepal (49.5%, a difference of 0.19%), and Croatian (49.3%, a difference of 0.31%).
| Demographics | Rating | Rank | Associate's Degree |
| Immigrants | England | 98.0 /100 | #95 | Exceptional 49.7% |
| Romanians | 98.0 /100 | #96 | Exceptional 49.7% |
| Immigrants | Ukraine | 98.0 /100 | #97 | Exceptional 49.7% |
| Immigrants | Northern Africa | 97.9 /100 | #98 | Exceptional 49.7% |
| Macedonians | 97.8 /100 | #99 | Exceptional 49.6% |
| Immigrants | Nepal | 97.5 /100 | #100 | Exceptional 49.5% |
| Northern Europeans | 97.3 /100 | #101 | Exceptional 49.5% |
| Chileans | 97.3 /100 | #102 | Exceptional 49.4% |
| Ukrainians | 97.1 /100 | #103 | Exceptional 49.4% |
| Venezuelans | 97.0 /100 | #104 | Exceptional 49.4% |
| Croatians | 96.8 /100 | #105 | Exceptional 49.3% |
| Immigrants | Italy | 96.7 /100 | #106 | Exceptional 49.3% |
| Syrians | 96.7 /100 | #107 | Exceptional 49.3% |
| Jordanians | 96.6 /100 | #108 | Exceptional 49.2% |
| Immigrants | Morocco | 96.3 /100 | #109 | Exceptional 49.2% |
Demographics Similar to Americans by Associate's Degree
In terms of associate's degree, the demographic groups most similar to Americans are Chippewa (40.7%, a difference of 0.050%), Central American Indian (40.8%, a difference of 0.18%), Immigrants from Laos (40.7%, a difference of 0.23%), Belizean (40.6%, a difference of 0.30%), and Hawaiian (40.9%, a difference of 0.38%).
| Demographics | Rating | Rank | Associate's Degree |
| Bahamians | 0.4 /100 | #262 | Tragic 41.5% |
| Immigrants | Jamaica | 0.3 /100 | #263 | Tragic 41.5% |
| Osage | 0.3 /100 | #264 | Tragic 41.5% |
| Africans | 0.2 /100 | #265 | Tragic 41.1% |
| Samoans | 0.2 /100 | #266 | Tragic 41.1% |
| Hawaiians | 0.2 /100 | #267 | Tragic 40.9% |
| Central American Indians | 0.2 /100 | #268 | Tragic 40.8% |
| Americans | 0.2 /100 | #269 | Tragic 40.8% |
| Chippewa | 0.2 /100 | #270 | Tragic 40.7% |
| Immigrants | Laos | 0.1 /100 | #271 | Tragic 40.7% |
| Belizeans | 0.1 /100 | #272 | Tragic 40.6% |
| Puget Sound Salish | 0.1 /100 | #273 | Tragic 40.5% |
| Immigrants | Dominica | 0.1 /100 | #274 | Tragic 40.5% |
| Potawatomi | 0.1 /100 | #275 | Tragic 40.4% |
| Puerto Ricans | 0.1 /100 | #276 | Tragic 40.4% |