Immigrants from Kuwait vs American Associate's Degree
COMPARE
Immigrants from Kuwait
American
Associate's Degree
Associate's Degree Comparison
Immigrants from Kuwait
Americans
52.4%
ASSOCIATE'S DEGREE
99.9/ 100
METRIC RATING
47th/ 347
METRIC RANK
40.8%
ASSOCIATE'S DEGREE
0.2/ 100
METRIC RATING
269th/ 347
METRIC RANK
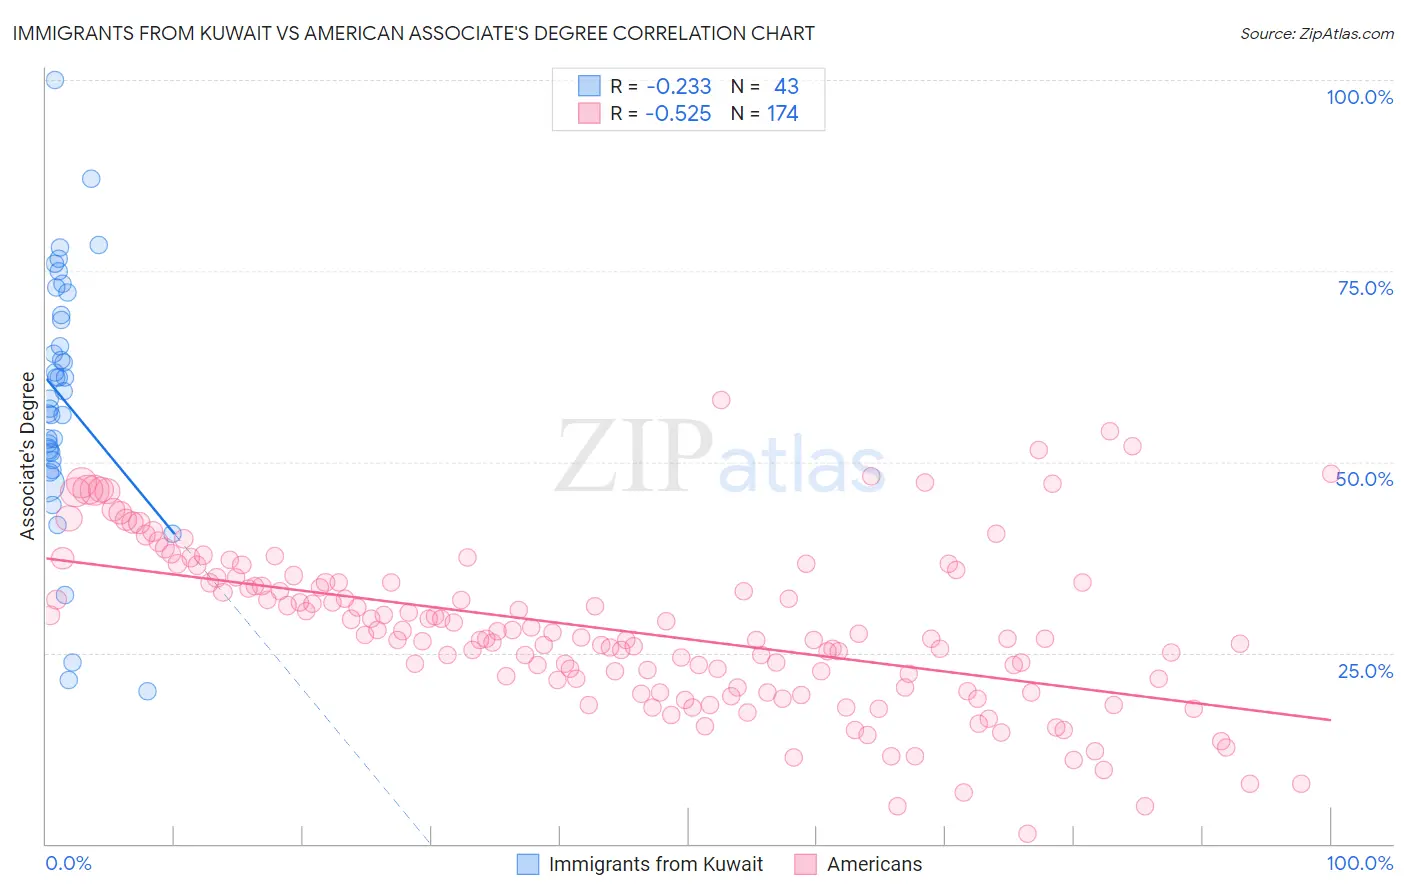
Immigrants from Kuwait vs American Associate's Degree Correlation Chart
The statistical analysis conducted on geographies consisting of 136,917,085 people shows a weak negative correlation between the proportion of Immigrants from Kuwait and percentage of population with at least associate's degree education in the United States with a correlation coefficient (R) of -0.233 and weighted average of 52.4%. Similarly, the statistical analysis conducted on geographies consisting of 581,858,249 people shows a substantial negative correlation between the proportion of Americans and percentage of population with at least associate's degree education in the United States with a correlation coefficient (R) of -0.525 and weighted average of 40.8%, a difference of 28.5%.
Associate's Degree Correlation Summary
| Measurement | Immigrants from Kuwait | American |
| Minimum | 19.9% | 1.4% |
| Maximum | 100.0% | 58.1% |
| Range | 80.1% | 56.7% |
| Mean | 58.2% | 28.0% |
| Median | 58.2% | 26.9% |
| Interquartile 25% (IQ1) | 50.2% | 20.4% |
| Interquartile 75% (IQ3) | 69.3% | 34.2% |
| Interquartile Range (IQR) | 19.1% | 13.8% |
| Standard Deviation (Sample) | 16.5% | 10.6% |
| Standard Deviation (Population) | 16.3% | 10.5% |
Similar Demographics by Associate's Degree
Demographics Similar to Immigrants from Kuwait by Associate's Degree
In terms of associate's degree, the demographic groups most similar to Immigrants from Kuwait are Immigrants from Bulgaria (52.4%, a difference of 0.010%), Immigrants from Lithuania (52.4%, a difference of 0.14%), Estonian (52.5%, a difference of 0.22%), Immigrants from Norway (52.2%, a difference of 0.26%), and Immigrants from South Africa (52.5%, a difference of 0.31%).
| Demographics | Rating | Rank | Associate's Degree |
| Immigrants | Latvia | 99.9 /100 | #40 | Exceptional 52.8% |
| Immigrants | Saudi Arabia | 99.9 /100 | #41 | Exceptional 52.6% |
| Immigrants | Malaysia | 99.9 /100 | #42 | Exceptional 52.5% |
| Immigrants | South Africa | 99.9 /100 | #43 | Exceptional 52.5% |
| Estonians | 99.9 /100 | #44 | Exceptional 52.5% |
| Immigrants | Lithuania | 99.9 /100 | #45 | Exceptional 52.4% |
| Immigrants | Bulgaria | 99.9 /100 | #46 | Exceptional 52.4% |
| Immigrants | Kuwait | 99.9 /100 | #47 | Exceptional 52.4% |
| Immigrants | Norway | 99.9 /100 | #48 | Exceptional 52.2% |
| Immigrants | Austria | 99.9 /100 | #49 | Exceptional 52.1% |
| Asians | 99.9 /100 | #50 | Exceptional 52.1% |
| Immigrants | Greece | 99.9 /100 | #51 | Exceptional 52.1% |
| Bolivians | 99.8 /100 | #52 | Exceptional 52.0% |
| Immigrants | Asia | 99.8 /100 | #53 | Exceptional 52.0% |
| Immigrants | Spain | 99.8 /100 | #54 | Exceptional 51.9% |
Demographics Similar to Americans by Associate's Degree
In terms of associate's degree, the demographic groups most similar to Americans are Chippewa (40.7%, a difference of 0.050%), Central American Indian (40.8%, a difference of 0.18%), Immigrants from Laos (40.7%, a difference of 0.23%), Belizean (40.6%, a difference of 0.30%), and Hawaiian (40.9%, a difference of 0.38%).
| Demographics | Rating | Rank | Associate's Degree |
| Bahamians | 0.4 /100 | #262 | Tragic 41.5% |
| Immigrants | Jamaica | 0.3 /100 | #263 | Tragic 41.5% |
| Osage | 0.3 /100 | #264 | Tragic 41.5% |
| Africans | 0.2 /100 | #265 | Tragic 41.1% |
| Samoans | 0.2 /100 | #266 | Tragic 41.1% |
| Hawaiians | 0.2 /100 | #267 | Tragic 40.9% |
| Central American Indians | 0.2 /100 | #268 | Tragic 40.8% |
| Americans | 0.2 /100 | #269 | Tragic 40.8% |
| Chippewa | 0.2 /100 | #270 | Tragic 40.7% |
| Immigrants | Laos | 0.1 /100 | #271 | Tragic 40.7% |
| Belizeans | 0.1 /100 | #272 | Tragic 40.6% |
| Puget Sound Salish | 0.1 /100 | #273 | Tragic 40.5% |
| Immigrants | Dominica | 0.1 /100 | #274 | Tragic 40.5% |
| Potawatomi | 0.1 /100 | #275 | Tragic 40.4% |
| Puerto Ricans | 0.1 /100 | #276 | Tragic 40.4% |