Syrian vs American Associate's Degree
COMPARE
Syrian
American
Associate's Degree
Associate's Degree Comparison
Syrians
Americans
49.3%
ASSOCIATE'S DEGREE
96.7/ 100
METRIC RATING
107th/ 347
METRIC RANK
40.8%
ASSOCIATE'S DEGREE
0.2/ 100
METRIC RATING
269th/ 347
METRIC RANK
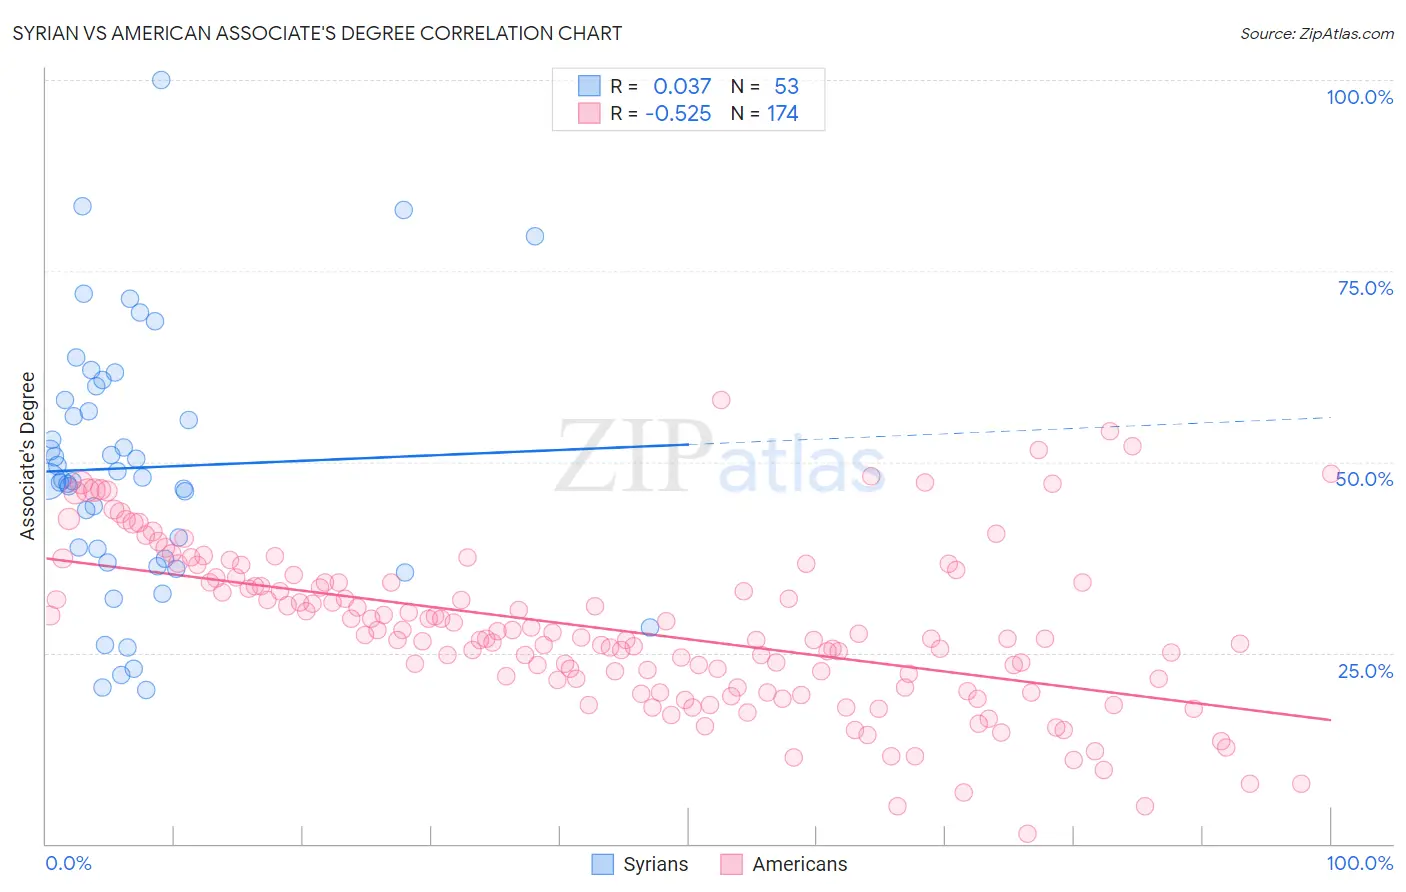
Syrian vs American Associate's Degree Correlation Chart
The statistical analysis conducted on geographies consisting of 266,303,320 people shows no correlation between the proportion of Syrians and percentage of population with at least associate's degree education in the United States with a correlation coefficient (R) of 0.037 and weighted average of 49.3%. Similarly, the statistical analysis conducted on geographies consisting of 581,858,249 people shows a substantial negative correlation between the proportion of Americans and percentage of population with at least associate's degree education in the United States with a correlation coefficient (R) of -0.525 and weighted average of 40.8%, a difference of 20.9%.
Associate's Degree Correlation Summary
| Measurement | Syrian | American |
| Minimum | 20.2% | 1.4% |
| Maximum | 100.0% | 58.1% |
| Range | 79.8% | 56.7% |
| Mean | 49.2% | 28.0% |
| Median | 47.6% | 26.9% |
| Interquartile 25% (IQ1) | 37.1% | 20.4% |
| Interquartile 75% (IQ3) | 59.0% | 34.2% |
| Interquartile Range (IQR) | 21.9% | 13.8% |
| Standard Deviation (Sample) | 17.0% | 10.6% |
| Standard Deviation (Population) | 16.9% | 10.5% |
Similar Demographics by Associate's Degree
Demographics Similar to Syrians by Associate's Degree
In terms of associate's degree, the demographic groups most similar to Syrians are Croatian (49.3%, a difference of 0.030%), Immigrants from Italy (49.3%, a difference of 0.030%), Jordanian (49.2%, a difference of 0.060%), Venezuelan (49.4%, a difference of 0.18%), and Immigrants from Morocco (49.2%, a difference of 0.20%).
| Demographics | Rating | Rank | Associate's Degree |
| Immigrants | Nepal | 97.5 /100 | #100 | Exceptional 49.5% |
| Northern Europeans | 97.3 /100 | #101 | Exceptional 49.5% |
| Chileans | 97.3 /100 | #102 | Exceptional 49.4% |
| Ukrainians | 97.1 /100 | #103 | Exceptional 49.4% |
| Venezuelans | 97.0 /100 | #104 | Exceptional 49.4% |
| Croatians | 96.8 /100 | #105 | Exceptional 49.3% |
| Immigrants | Italy | 96.7 /100 | #106 | Exceptional 49.3% |
| Syrians | 96.7 /100 | #107 | Exceptional 49.3% |
| Jordanians | 96.6 /100 | #108 | Exceptional 49.2% |
| Immigrants | Morocco | 96.3 /100 | #109 | Exceptional 49.2% |
| Austrians | 95.8 /100 | #110 | Exceptional 49.1% |
| Immigrants | Venezuela | 95.8 /100 | #111 | Exceptional 49.1% |
| Immigrants | Chile | 95.3 /100 | #112 | Exceptional 49.0% |
| Palestinians | 95.3 /100 | #113 | Exceptional 49.0% |
| Arabs | 95.3 /100 | #114 | Exceptional 49.0% |
Demographics Similar to Americans by Associate's Degree
In terms of associate's degree, the demographic groups most similar to Americans are Chippewa (40.7%, a difference of 0.050%), Central American Indian (40.8%, a difference of 0.18%), Immigrants from Laos (40.7%, a difference of 0.23%), Belizean (40.6%, a difference of 0.30%), and Hawaiian (40.9%, a difference of 0.38%).
| Demographics | Rating | Rank | Associate's Degree |
| Bahamians | 0.4 /100 | #262 | Tragic 41.5% |
| Immigrants | Jamaica | 0.3 /100 | #263 | Tragic 41.5% |
| Osage | 0.3 /100 | #264 | Tragic 41.5% |
| Africans | 0.2 /100 | #265 | Tragic 41.1% |
| Samoans | 0.2 /100 | #266 | Tragic 41.1% |
| Hawaiians | 0.2 /100 | #267 | Tragic 40.9% |
| Central American Indians | 0.2 /100 | #268 | Tragic 40.8% |
| Americans | 0.2 /100 | #269 | Tragic 40.8% |
| Chippewa | 0.2 /100 | #270 | Tragic 40.7% |
| Immigrants | Laos | 0.1 /100 | #271 | Tragic 40.7% |
| Belizeans | 0.1 /100 | #272 | Tragic 40.6% |
| Puget Sound Salish | 0.1 /100 | #273 | Tragic 40.5% |
| Immigrants | Dominica | 0.1 /100 | #274 | Tragic 40.5% |
| Potawatomi | 0.1 /100 | #275 | Tragic 40.4% |
| Puerto Ricans | 0.1 /100 | #276 | Tragic 40.4% |