Sudanese vs American In Labor Force | Age 35-44
COMPARE
Sudanese
American
In Labor Force | Age 35-44
In Labor Force | Age 35-44 Comparison
Sudanese
Americans
85.0%
IN LABOR FORCE | AGE 35-44
99.0/ 100
METRIC RATING
69th/ 347
METRIC RANK
82.4%
IN LABOR FORCE | AGE 35-44
0.0/ 100
METRIC RATING
302nd/ 347
METRIC RANK
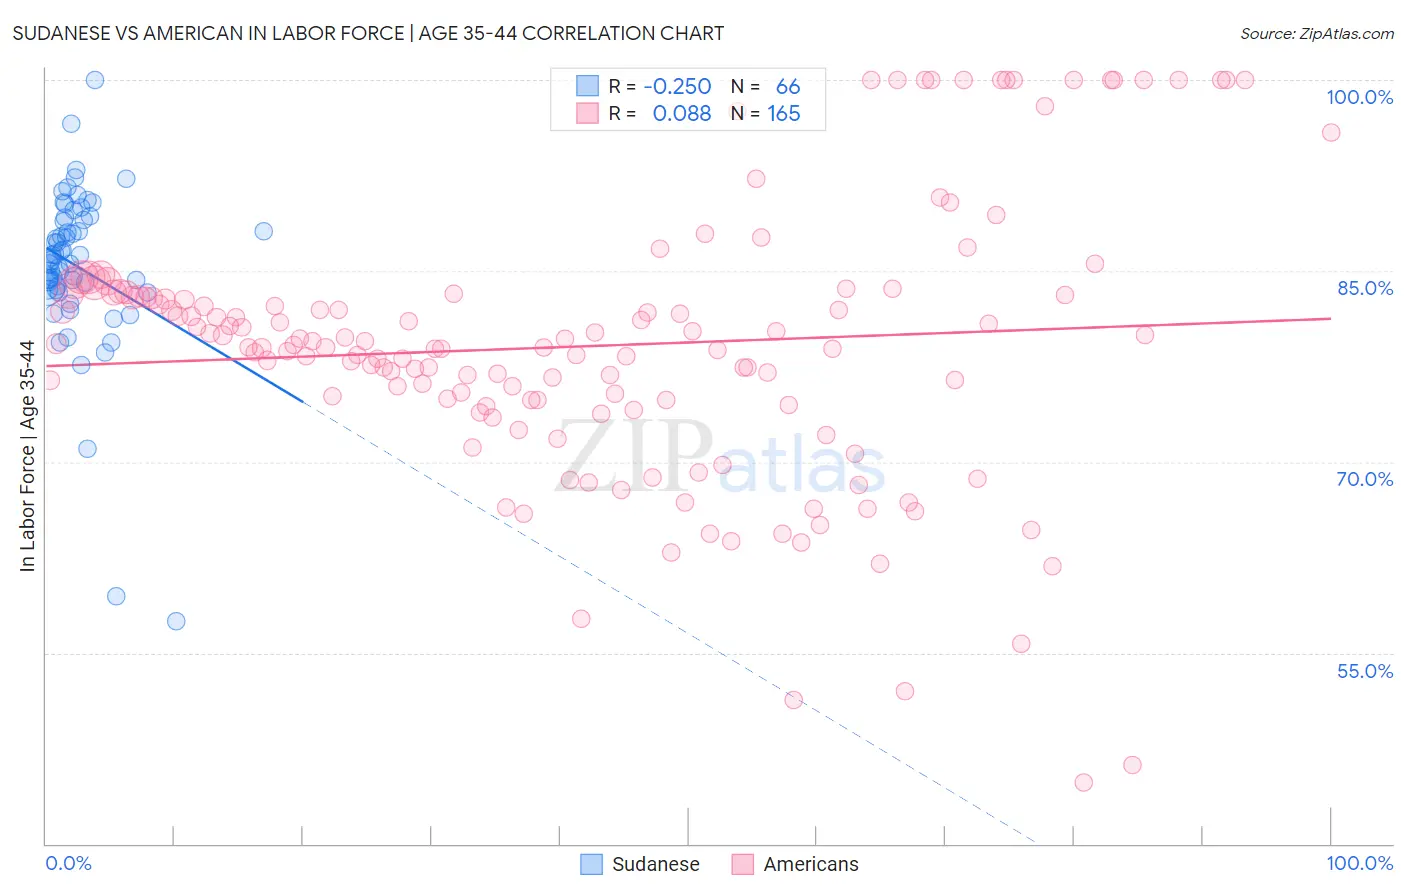
Sudanese vs American In Labor Force | Age 35-44 Correlation Chart
The statistical analysis conducted on geographies consisting of 110,129,282 people shows a weak negative correlation between the proportion of Sudanese and labor force participation rate among population between the ages 35 and 44 in the United States with a correlation coefficient (R) of -0.250 and weighted average of 85.0%. Similarly, the statistical analysis conducted on geographies consisting of 581,120,532 people shows a slight positive correlation between the proportion of Americans and labor force participation rate among population between the ages 35 and 44 in the United States with a correlation coefficient (R) of 0.088 and weighted average of 82.4%, a difference of 3.1%.
In Labor Force | Age 35-44 Correlation Summary
| Measurement | Sudanese | American |
| Minimum | 57.5% | 44.8% |
| Maximum | 100.0% | 100.0% |
| Range | 42.5% | 55.2% |
| Mean | 85.3% | 79.1% |
| Median | 85.9% | 79.0% |
| Interquartile 25% (IQ1) | 83.5% | 74.7% |
| Interquartile 75% (IQ3) | 89.0% | 83.2% |
| Interquartile Range (IQR) | 5.5% | 8.5% |
| Standard Deviation (Sample) | 6.6% | 10.7% |
| Standard Deviation (Population) | 6.5% | 10.7% |
Similar Demographics by In Labor Force | Age 35-44
Demographics Similar to Sudanese by In Labor Force | Age 35-44
In terms of in labor force | age 35-44, the demographic groups most similar to Sudanese are Brazilian (85.0%, a difference of 0.0%), Immigrants from Italy (85.0%, a difference of 0.010%), Italian (85.0%, a difference of 0.010%), Russian (85.0%, a difference of 0.010%), and Immigrants from Haiti (85.0%, a difference of 0.020%).
| Demographics | Rating | Rank | In Labor Force | Age 35-44 |
| Immigrants | Moldova | 99.3 /100 | #62 | Exceptional 85.0% |
| Immigrants | Uganda | 99.3 /100 | #63 | Exceptional 85.0% |
| Swedes | 99.2 /100 | #64 | Exceptional 85.0% |
| Immigrants | Brazil | 99.2 /100 | #65 | Exceptional 85.0% |
| Immigrants | Haiti | 99.1 /100 | #66 | Exceptional 85.0% |
| Immigrants | Italy | 99.1 /100 | #67 | Exceptional 85.0% |
| Italians | 99.1 /100 | #68 | Exceptional 85.0% |
| Sudanese | 99.0 /100 | #69 | Exceptional 85.0% |
| Brazilians | 99.0 /100 | #70 | Exceptional 85.0% |
| Russians | 99.0 /100 | #71 | Exceptional 85.0% |
| Immigrants | Singapore | 98.9 /100 | #72 | Exceptional 85.0% |
| Immigrants | Sri Lanka | 98.9 /100 | #73 | Exceptional 85.0% |
| Colombians | 98.8 /100 | #74 | Exceptional 85.0% |
| Immigrants | South Central Asia | 98.7 /100 | #75 | Exceptional 85.0% |
| Immigrants | Cuba | 98.6 /100 | #76 | Exceptional 84.9% |
Demographics Similar to Americans by In Labor Force | Age 35-44
In terms of in labor force | age 35-44, the demographic groups most similar to Americans are Nepalese (82.4%, a difference of 0.0%), Marshallese (82.4%, a difference of 0.010%), Spanish American Indian (82.5%, a difference of 0.080%), Central American Indian (82.5%, a difference of 0.10%), and Tlingit-Haida (82.5%, a difference of 0.16%).
| Demographics | Rating | Rank | In Labor Force | Age 35-44 |
| Immigrants | Lebanon | 0.0 /100 | #295 | Tragic 82.7% |
| Mexican American Indians | 0.0 /100 | #296 | Tragic 82.6% |
| Hmong | 0.0 /100 | #297 | Tragic 82.6% |
| Ottawa | 0.0 /100 | #298 | Tragic 82.6% |
| Tlingit-Haida | 0.0 /100 | #299 | Tragic 82.5% |
| Central American Indians | 0.0 /100 | #300 | Tragic 82.5% |
| Spanish American Indians | 0.0 /100 | #301 | Tragic 82.5% |
| Americans | 0.0 /100 | #302 | Tragic 82.4% |
| Nepalese | 0.0 /100 | #303 | Tragic 82.4% |
| Marshallese | 0.0 /100 | #304 | Tragic 82.4% |
| Shoshone | 0.0 /100 | #305 | Tragic 82.2% |
| Blacks/African Americans | 0.0 /100 | #306 | Tragic 82.2% |
| Hispanics or Latinos | 0.0 /100 | #307 | Tragic 82.1% |
| Immigrants | Central America | 0.0 /100 | #308 | Tragic 82.0% |
| Cree | 0.0 /100 | #309 | Tragic 82.0% |