Jamaican vs American Associate's Degree
COMPARE
Jamaican
American
Associate's Degree
Associate's Degree Comparison
Jamaicans
Americans
42.1%
ASSOCIATE'S DEGREE
0.7/ 100
METRIC RATING
249th/ 347
METRIC RANK
40.8%
ASSOCIATE'S DEGREE
0.2/ 100
METRIC RATING
269th/ 347
METRIC RANK
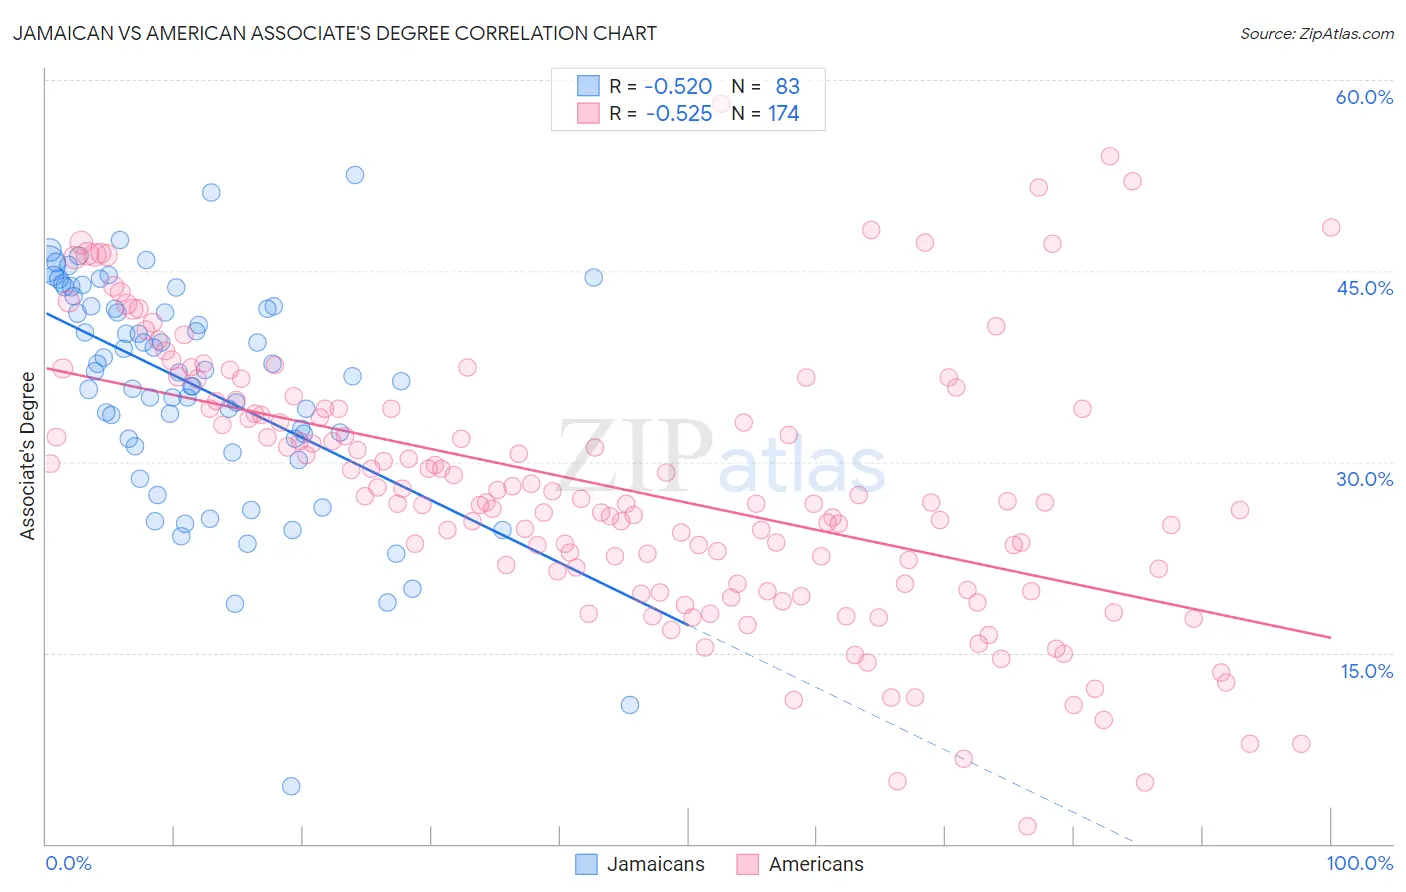
Jamaican vs American Associate's Degree Correlation Chart
The statistical analysis conducted on geographies consisting of 368,030,405 people shows a substantial negative correlation between the proportion of Jamaicans and percentage of population with at least associate's degree education in the United States with a correlation coefficient (R) of -0.520 and weighted average of 42.1%. Similarly, the statistical analysis conducted on geographies consisting of 581,858,249 people shows a substantial negative correlation between the proportion of Americans and percentage of population with at least associate's degree education in the United States with a correlation coefficient (R) of -0.525 and weighted average of 40.8%, a difference of 3.3%.
Associate's Degree Correlation Summary
| Measurement | Jamaican | American |
| Minimum | 4.5% | 1.4% |
| Maximum | 52.5% | 58.1% |
| Range | 48.0% | 56.7% |
| Mean | 36.0% | 28.0% |
| Median | 37.1% | 26.9% |
| Interquartile 25% (IQ1) | 31.8% | 20.4% |
| Interquartile 75% (IQ3) | 42.2% | 34.2% |
| Interquartile Range (IQR) | 10.4% | 13.8% |
| Standard Deviation (Sample) | 8.8% | 10.6% |
| Standard Deviation (Population) | 8.8% | 10.5% |
Demographics Similar to Jamaicans and Americans by Associate's Degree
In terms of associate's degree, the demographic groups most similar to Jamaicans are U.S. Virgin Islander (42.1%, a difference of 0.010%), Immigrants from Bahamas (42.1%, a difference of 0.030%), French American Indian (42.0%, a difference of 0.39%), Indonesian (41.9%, a difference of 0.50%), and Cuban (41.9%, a difference of 0.56%). Similarly, the demographic groups most similar to Americans are Central American Indian (40.8%, a difference of 0.18%), Hawaiian (40.9%, a difference of 0.38%), African (41.1%, a difference of 0.94%), Samoan (41.1%, a difference of 0.94%), and Osage (41.5%, a difference of 1.7%).
| Demographics | Rating | Rank | Associate's Degree |
| Jamaicans | 0.7 /100 | #249 | Tragic 42.1% |
| U.S. Virgin Islanders | 0.7 /100 | #250 | Tragic 42.1% |
| Immigrants | Bahamas | 0.7 /100 | #251 | Tragic 42.1% |
| French American Indians | 0.6 /100 | #252 | Tragic 42.0% |
| Indonesians | 0.6 /100 | #253 | Tragic 41.9% |
| Cubans | 0.6 /100 | #254 | Tragic 41.9% |
| Immigrants | Guyana | 0.5 /100 | #255 | Tragic 41.8% |
| Immigrants | Congo | 0.5 /100 | #256 | Tragic 41.8% |
| Spanish Americans | 0.5 /100 | #257 | Tragic 41.8% |
| Japanese | 0.5 /100 | #258 | Tragic 41.7% |
| Malaysians | 0.4 /100 | #259 | Tragic 41.6% |
| Marshallese | 0.4 /100 | #260 | Tragic 41.6% |
| Nicaraguans | 0.4 /100 | #261 | Tragic 41.5% |
| Bahamians | 0.4 /100 | #262 | Tragic 41.5% |
| Immigrants | Jamaica | 0.3 /100 | #263 | Tragic 41.5% |
| Osage | 0.3 /100 | #264 | Tragic 41.5% |
| Africans | 0.2 /100 | #265 | Tragic 41.1% |
| Samoans | 0.2 /100 | #266 | Tragic 41.1% |
| Hawaiians | 0.2 /100 | #267 | Tragic 40.9% |
| Central American Indians | 0.2 /100 | #268 | Tragic 40.8% |
| Americans | 0.2 /100 | #269 | Tragic 40.8% |