Sudanese vs American Professional Degree
COMPARE
Sudanese
American
Professional Degree
Professional Degree Comparison
Sudanese
Americans
4.6%
PROFESSIONAL DEGREE
81.3/ 100
METRIC RATING
142nd/ 347
METRIC RANK
3.6%
PROFESSIONAL DEGREE
0.5/ 100
METRIC RATING
273rd/ 347
METRIC RANK
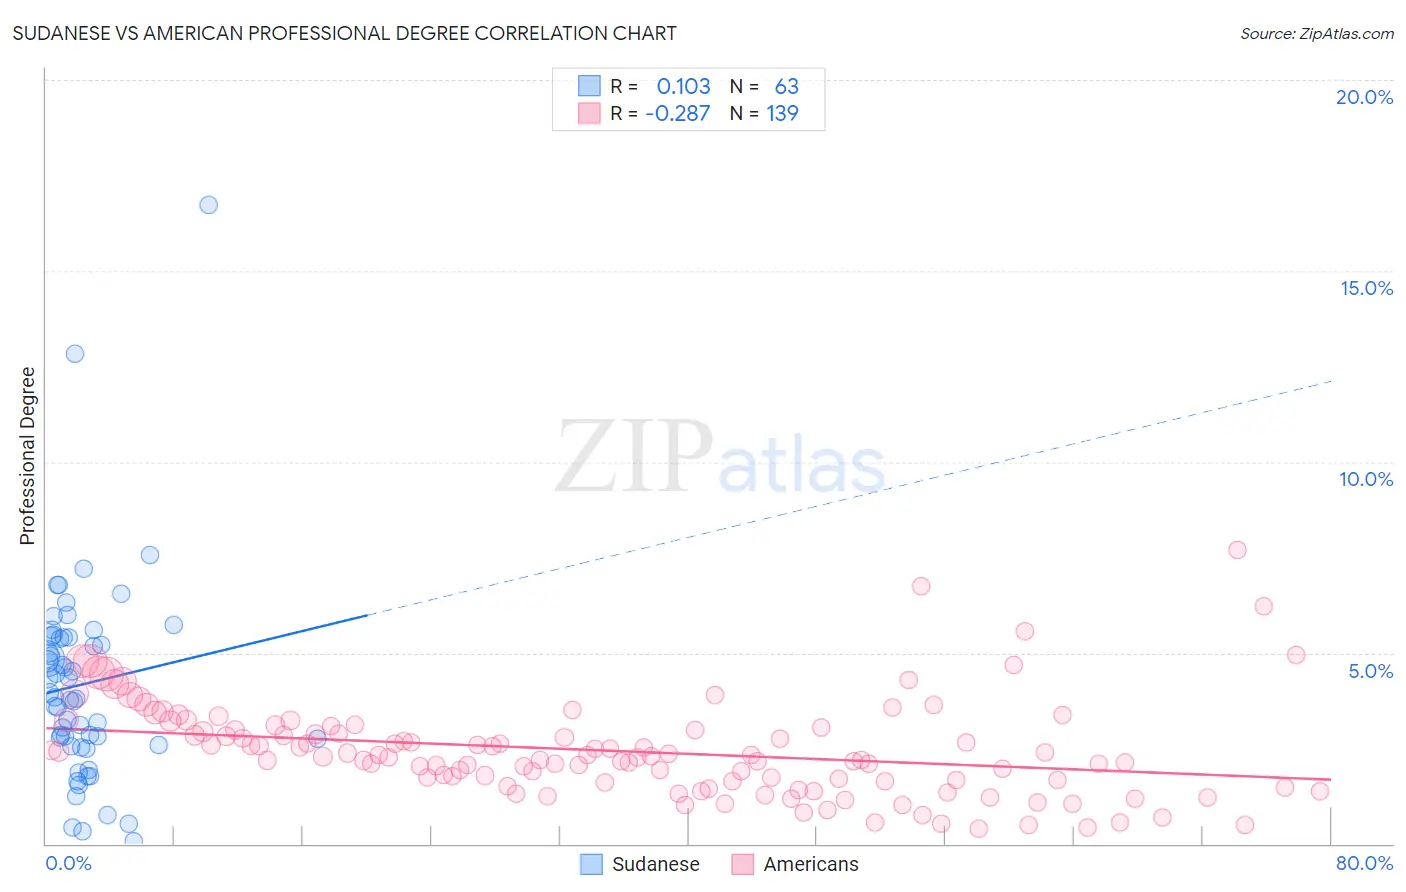
Sudanese vs American Professional Degree Correlation Chart
The statistical analysis conducted on geographies consisting of 110,066,536 people shows a poor positive correlation between the proportion of Sudanese and percentage of population with at least professional degree education in the United States with a correlation coefficient (R) of 0.103 and weighted average of 4.6%. Similarly, the statistical analysis conducted on geographies consisting of 570,969,920 people shows a weak negative correlation between the proportion of Americans and percentage of population with at least professional degree education in the United States with a correlation coefficient (R) of -0.287 and weighted average of 3.6%, a difference of 30.2%.
Professional Degree Correlation Summary
| Measurement | Sudanese | American |
| Minimum | 0.061% | 0.39% |
| Maximum | 16.7% | 7.7% |
| Range | 16.7% | 7.3% |
| Mean | 4.2% | 2.4% |
| Median | 3.8% | 2.3% |
| Interquartile 25% (IQ1) | 2.6% | 1.6% |
| Interquartile 75% (IQ3) | 5.4% | 3.0% |
| Interquartile Range (IQR) | 2.8% | 1.4% |
| Standard Deviation (Sample) | 2.7% | 1.2% |
| Standard Deviation (Population) | 2.7% | 1.2% |
Similar Demographics by Professional Degree
Demographics Similar to Sudanese by Professional Degree
In terms of professional degree, the demographic groups most similar to Sudanese are Hungarian (4.6%, a difference of 0.11%), Basque (4.6%, a difference of 0.13%), Immigrants from South America (4.6%, a difference of 0.18%), Uruguayan (4.6%, a difference of 0.24%), and Luxembourger (4.6%, a difference of 0.55%).
| Demographics | Rating | Rank | Professional Degree |
| Macedonians | 89.8 /100 | #135 | Excellent 4.8% |
| Immigrants | Jordan | 89.0 /100 | #136 | Excellent 4.7% |
| Jordanians | 88.9 /100 | #137 | Excellent 4.7% |
| Afghans | 88.8 /100 | #138 | Excellent 4.7% |
| South Americans | 85.6 /100 | #139 | Excellent 4.7% |
| Canadians | 84.4 /100 | #140 | Excellent 4.7% |
| Basques | 81.8 /100 | #141 | Excellent 4.6% |
| Sudanese | 81.3 /100 | #142 | Excellent 4.6% |
| Hungarians | 80.8 /100 | #143 | Excellent 4.6% |
| Immigrants | South America | 80.5 /100 | #144 | Excellent 4.6% |
| Uruguayans | 80.2 /100 | #145 | Excellent 4.6% |
| Luxembourgers | 78.7 /100 | #146 | Good 4.6% |
| Colombians | 77.7 /100 | #147 | Good 4.6% |
| Slovenes | 76.1 /100 | #148 | Good 4.6% |
| Senegalese | 75.3 /100 | #149 | Good 4.6% |
Demographics Similar to Americans by Professional Degree
In terms of professional degree, the demographic groups most similar to Americans are Immigrants from Jamaica (3.6%, a difference of 0.060%), Belizean (3.6%, a difference of 0.090%), Potawatomi (3.6%, a difference of 0.13%), Immigrants from Dominica (3.6%, a difference of 0.35%), and Liberian (3.6%, a difference of 0.40%).
| Demographics | Rating | Rank | Professional Degree |
| Central American Indians | 0.8 /100 | #266 | Tragic 3.6% |
| Delaware | 0.7 /100 | #267 | Tragic 3.6% |
| Aleuts | 0.7 /100 | #268 | Tragic 3.6% |
| Immigrants | Cuba | 0.6 /100 | #269 | Tragic 3.6% |
| Central Americans | 0.6 /100 | #270 | Tragic 3.6% |
| Belizeans | 0.5 /100 | #271 | Tragic 3.6% |
| Immigrants | Jamaica | 0.5 /100 | #272 | Tragic 3.6% |
| Americans | 0.5 /100 | #273 | Tragic 3.6% |
| Potawatomi | 0.5 /100 | #274 | Tragic 3.6% |
| Immigrants | Dominica | 0.5 /100 | #275 | Tragic 3.6% |
| Liberians | 0.5 /100 | #276 | Tragic 3.6% |
| Cheyenne | 0.5 /100 | #277 | Tragic 3.6% |
| Japanese | 0.5 /100 | #278 | Tragic 3.5% |
| Immigrants | Portugal | 0.5 /100 | #279 | Tragic 3.5% |
| Dominicans | 0.5 /100 | #280 | Tragic 3.5% |