Immigrants from Latin America vs American Associate's Degree
COMPARE
Immigrants from Latin America
American
Associate's Degree
Associate's Degree Comparison
Immigrants from Latin America
Americans
37.9%
ASSOCIATE'S DEGREE
0.0/ 100
METRIC RATING
311th/ 347
METRIC RANK
40.8%
ASSOCIATE'S DEGREE
0.2/ 100
METRIC RATING
269th/ 347
METRIC RANK
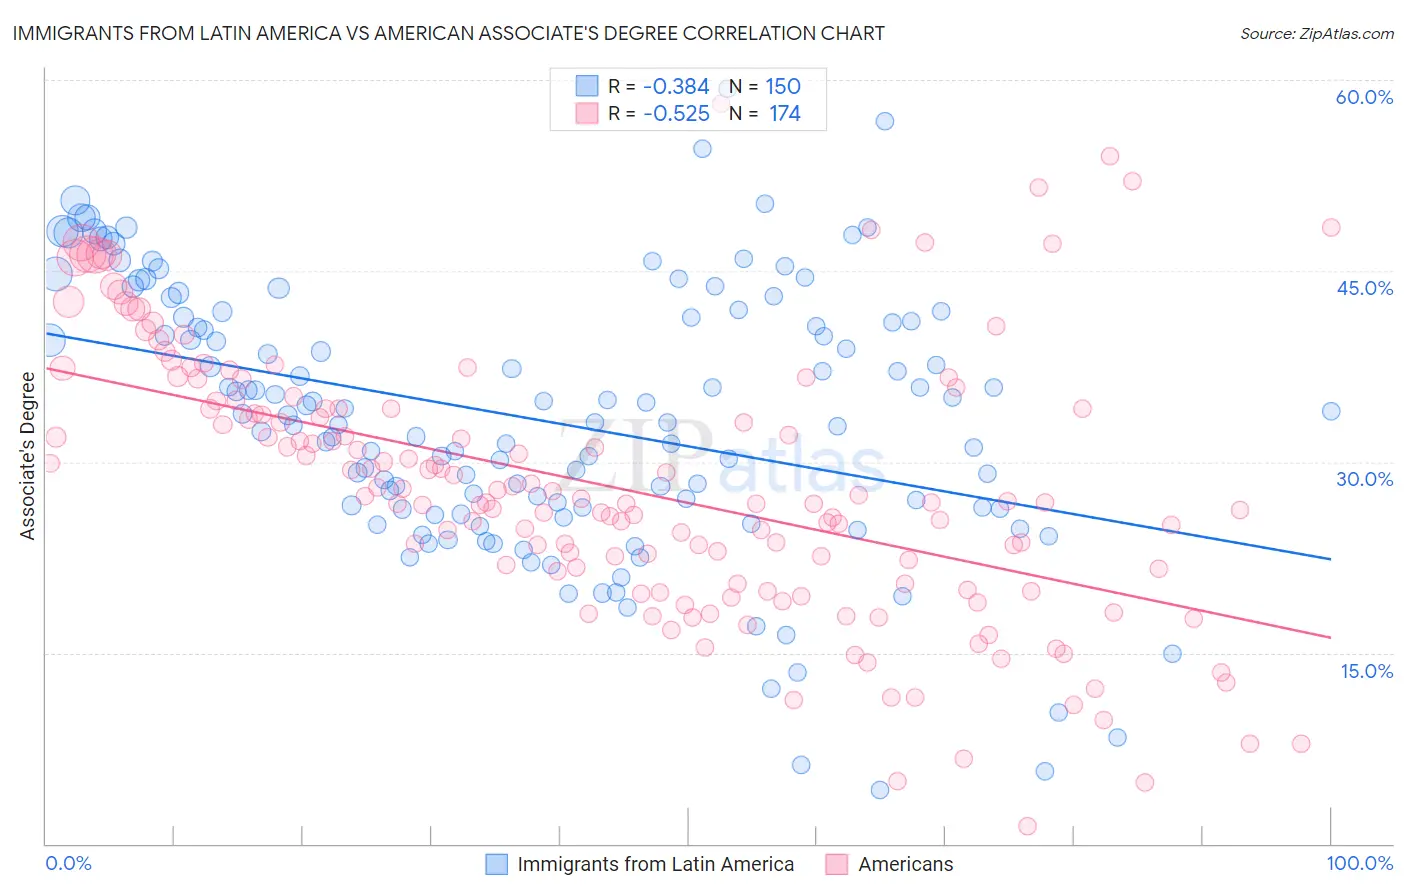
Immigrants from Latin America vs American Associate's Degree Correlation Chart
The statistical analysis conducted on geographies consisting of 558,543,762 people shows a mild negative correlation between the proportion of Immigrants from Latin America and percentage of population with at least associate's degree education in the United States with a correlation coefficient (R) of -0.384 and weighted average of 37.9%. Similarly, the statistical analysis conducted on geographies consisting of 581,858,249 people shows a substantial negative correlation between the proportion of Americans and percentage of population with at least associate's degree education in the United States with a correlation coefficient (R) of -0.525 and weighted average of 40.8%, a difference of 7.6%.
Associate's Degree Correlation Summary
| Measurement | Immigrants from Latin America | American |
| Minimum | 4.2% | 1.4% |
| Maximum | 59.3% | 58.1% |
| Range | 55.1% | 56.7% |
| Mean | 33.3% | 28.0% |
| Median | 33.4% | 26.9% |
| Interquartile 25% (IQ1) | 26.3% | 20.4% |
| Interquartile 75% (IQ3) | 41.3% | 34.2% |
| Interquartile Range (IQR) | 15.0% | 13.8% |
| Standard Deviation (Sample) | 10.6% | 10.6% |
| Standard Deviation (Population) | 10.6% | 10.5% |
Similar Demographics by Associate's Degree
Demographics Similar to Immigrants from Latin America by Associate's Degree
In terms of associate's degree, the demographic groups most similar to Immigrants from Latin America are Immigrants from Dominican Republic (37.9%, a difference of 0.11%), Choctaw (37.8%, a difference of 0.22%), Hispanic or Latino (37.7%, a difference of 0.37%), Seminole (37.7%, a difference of 0.42%), and Immigrants from Guatemala (38.1%, a difference of 0.73%).
| Demographics | Rating | Rank | Associate's Degree |
| Sioux | 0.0 /100 | #304 | Tragic 38.5% |
| Immigrants | Honduras | 0.0 /100 | #305 | Tragic 38.5% |
| Shoshone | 0.0 /100 | #306 | Tragic 38.4% |
| Immigrants | El Salvador | 0.0 /100 | #307 | Tragic 38.4% |
| Mexican American Indians | 0.0 /100 | #308 | Tragic 38.2% |
| Immigrants | Guatemala | 0.0 /100 | #309 | Tragic 38.1% |
| Immigrants | Dominican Republic | 0.0 /100 | #310 | Tragic 37.9% |
| Immigrants | Latin America | 0.0 /100 | #311 | Tragic 37.9% |
| Choctaw | 0.0 /100 | #312 | Tragic 37.8% |
| Hispanics or Latinos | 0.0 /100 | #313 | Tragic 37.7% |
| Seminole | 0.0 /100 | #314 | Tragic 37.7% |
| Creek | 0.0 /100 | #315 | Tragic 37.6% |
| Crow | 0.0 /100 | #316 | Tragic 37.6% |
| Yaqui | 0.0 /100 | #317 | Tragic 37.6% |
| Alaska Natives | 0.0 /100 | #318 | Tragic 37.5% |
Demographics Similar to Americans by Associate's Degree
In terms of associate's degree, the demographic groups most similar to Americans are Chippewa (40.7%, a difference of 0.050%), Central American Indian (40.8%, a difference of 0.18%), Immigrants from Laos (40.7%, a difference of 0.23%), Belizean (40.6%, a difference of 0.30%), and Hawaiian (40.9%, a difference of 0.38%).
| Demographics | Rating | Rank | Associate's Degree |
| Bahamians | 0.4 /100 | #262 | Tragic 41.5% |
| Immigrants | Jamaica | 0.3 /100 | #263 | Tragic 41.5% |
| Osage | 0.3 /100 | #264 | Tragic 41.5% |
| Africans | 0.2 /100 | #265 | Tragic 41.1% |
| Samoans | 0.2 /100 | #266 | Tragic 41.1% |
| Hawaiians | 0.2 /100 | #267 | Tragic 40.9% |
| Central American Indians | 0.2 /100 | #268 | Tragic 40.8% |
| Americans | 0.2 /100 | #269 | Tragic 40.8% |
| Chippewa | 0.2 /100 | #270 | Tragic 40.7% |
| Immigrants | Laos | 0.1 /100 | #271 | Tragic 40.7% |
| Belizeans | 0.1 /100 | #272 | Tragic 40.6% |
| Puget Sound Salish | 0.1 /100 | #273 | Tragic 40.5% |
| Immigrants | Dominica | 0.1 /100 | #274 | Tragic 40.5% |
| Potawatomi | 0.1 /100 | #275 | Tragic 40.4% |
| Puerto Ricans | 0.1 /100 | #276 | Tragic 40.4% |