Immigrants from Cuba vs American Associate's Degree
COMPARE
Immigrants from Cuba
American
Associate's Degree
Associate's Degree Comparison
Immigrants from Cuba
Americans
39.5%
ASSOCIATE'S DEGREE
0.0/ 100
METRIC RATING
288th/ 347
METRIC RANK
40.8%
ASSOCIATE'S DEGREE
0.2/ 100
METRIC RATING
269th/ 347
METRIC RANK
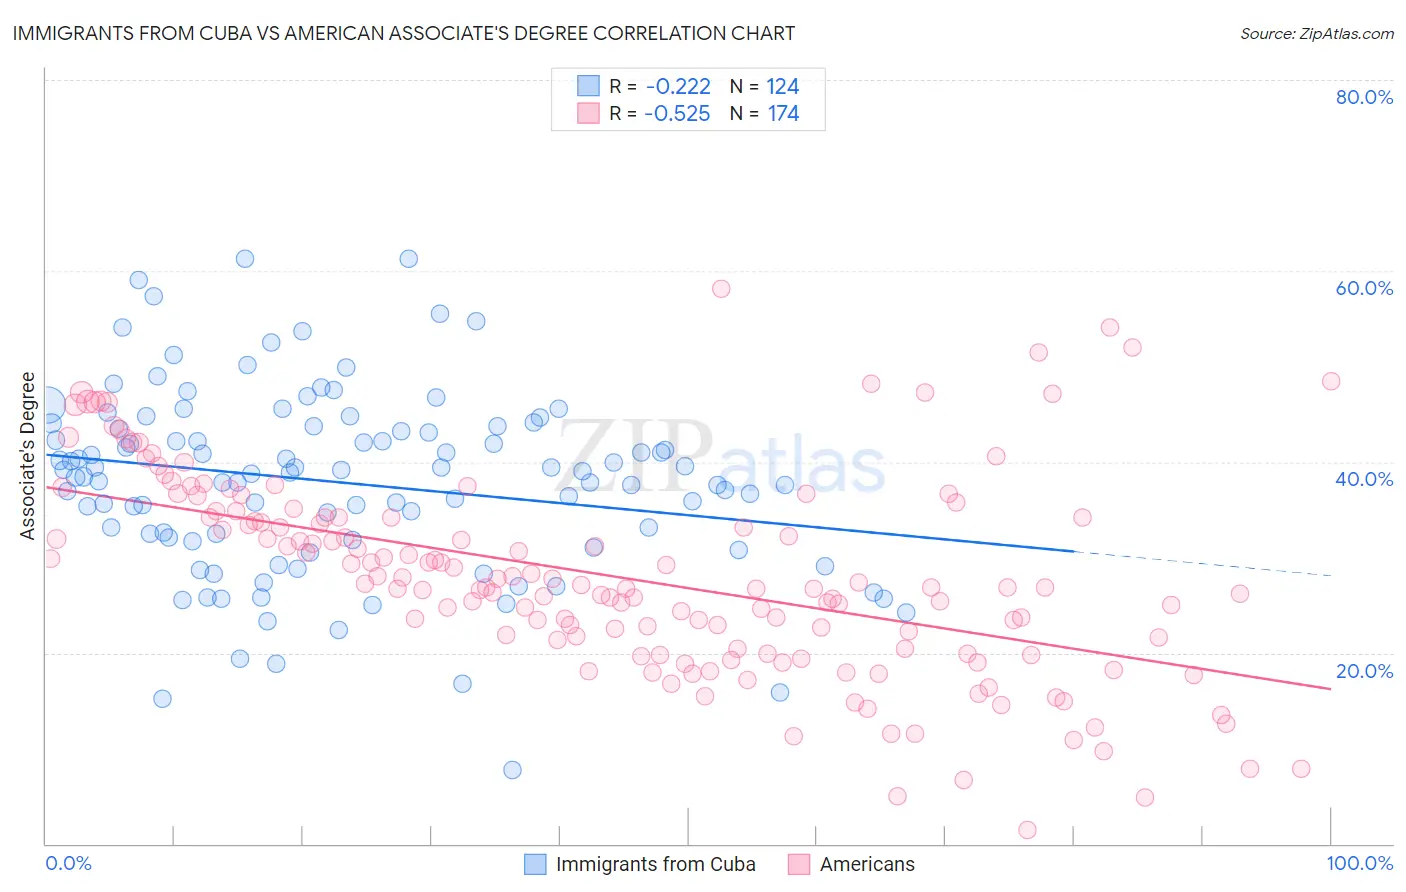
Immigrants from Cuba vs American Associate's Degree Correlation Chart
The statistical analysis conducted on geographies consisting of 325,963,552 people shows a weak negative correlation between the proportion of Immigrants from Cuba and percentage of population with at least associate's degree education in the United States with a correlation coefficient (R) of -0.222 and weighted average of 39.5%. Similarly, the statistical analysis conducted on geographies consisting of 581,858,249 people shows a substantial negative correlation between the proportion of Americans and percentage of population with at least associate's degree education in the United States with a correlation coefficient (R) of -0.525 and weighted average of 40.8%, a difference of 3.1%.
Associate's Degree Correlation Summary
| Measurement | Immigrants from Cuba | American |
| Minimum | 7.8% | 1.4% |
| Maximum | 61.3% | 58.1% |
| Range | 53.5% | 56.7% |
| Mean | 37.8% | 28.0% |
| Median | 38.8% | 26.9% |
| Interquartile 25% (IQ1) | 31.9% | 20.4% |
| Interquartile 75% (IQ3) | 43.6% | 34.2% |
| Interquartile Range (IQR) | 11.7% | 13.8% |
| Standard Deviation (Sample) | 9.7% | 10.6% |
| Standard Deviation (Population) | 9.6% | 10.5% |
Demographics Similar to Immigrants from Cuba and Americans by Associate's Degree
In terms of associate's degree, the demographic groups most similar to Immigrants from Cuba are Aleut (39.6%, a difference of 0.24%), Immigrants from Caribbean (39.7%, a difference of 0.50%), Immigrants from Belize (39.9%, a difference of 0.84%), Comanche (39.9%, a difference of 0.94%), and Haitian (40.0%, a difference of 1.1%). Similarly, the demographic groups most similar to Americans are Chippewa (40.7%, a difference of 0.050%), Central American Indian (40.8%, a difference of 0.18%), Immigrants from Laos (40.7%, a difference of 0.23%), Belizean (40.6%, a difference of 0.30%), and Puget Sound Salish (40.5%, a difference of 0.59%).
| Demographics | Rating | Rank | Associate's Degree |
| Central American Indians | 0.2 /100 | #268 | Tragic 40.8% |
| Americans | 0.2 /100 | #269 | Tragic 40.8% |
| Chippewa | 0.2 /100 | #270 | Tragic 40.7% |
| Immigrants | Laos | 0.1 /100 | #271 | Tragic 40.7% |
| Belizeans | 0.1 /100 | #272 | Tragic 40.6% |
| Puget Sound Salish | 0.1 /100 | #273 | Tragic 40.5% |
| Immigrants | Dominica | 0.1 /100 | #274 | Tragic 40.5% |
| Potawatomi | 0.1 /100 | #275 | Tragic 40.4% |
| Puerto Ricans | 0.1 /100 | #276 | Tragic 40.4% |
| Blackfeet | 0.1 /100 | #277 | Tragic 40.3% |
| Ottawa | 0.1 /100 | #278 | Tragic 40.3% |
| Immigrants | Nicaragua | 0.1 /100 | #279 | Tragic 40.3% |
| Immigrants | Micronesia | 0.1 /100 | #280 | Tragic 40.2% |
| Immigrants | Portugal | 0.1 /100 | #281 | Tragic 40.1% |
| Bangladeshis | 0.1 /100 | #282 | Tragic 40.0% |
| Haitians | 0.1 /100 | #283 | Tragic 40.0% |
| Comanche | 0.1 /100 | #284 | Tragic 39.9% |
| Immigrants | Belize | 0.1 /100 | #285 | Tragic 39.9% |
| Immigrants | Caribbean | 0.0 /100 | #286 | Tragic 39.7% |
| Aleuts | 0.0 /100 | #287 | Tragic 39.6% |
| Immigrants | Cuba | 0.0 /100 | #288 | Tragic 39.5% |